

Question: 1. Using the Survey Spring 2020 data set, we test the hypothesis that the average GPA of students taking Math 147 is greater than the
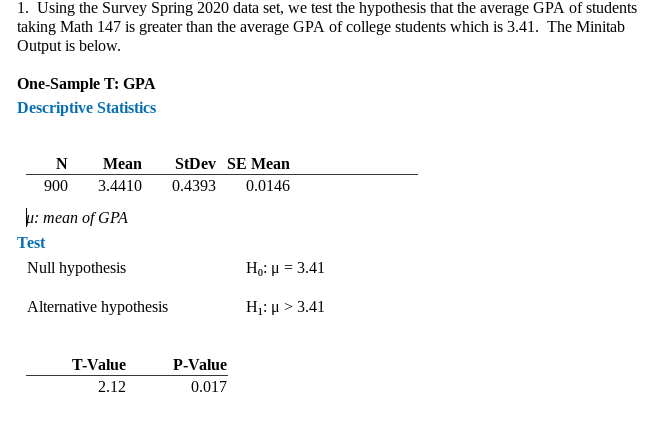
1. Using the Survey Spring 2020 data set, we test the hypothesis that the average GPA of students taking Math 147 is greater than the average GPA of college students which is 3.41. The Minitab Output is below.
One-Sample T: GPA
Descriptive Statistics
N is 900
Mean is 3.4410
StDev is 0.4393
SE Mean is .0146
?: mean of GPA
Test
Null hypothesis
H?: ? = 3.41
Alternative hypothesis
H?: ? > 3.41
T-Value is 2.12
P-Value is 0.017
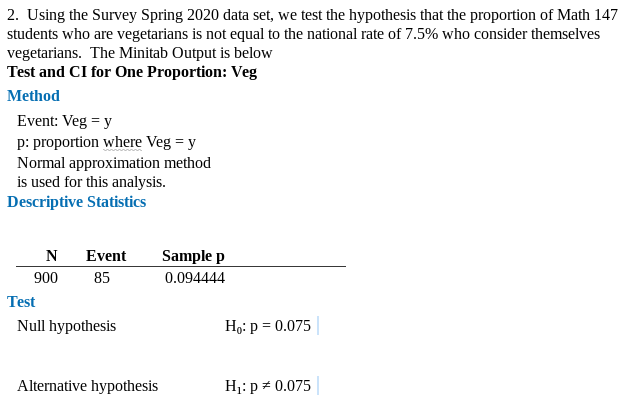
1. Using the Survey Spring 2020 data set, we test the hypothesis that the average GPA of students taking Math 147 is greater than the average GPA of college students which is 3.41. The Minitab Output is below. One-Sample T: GPA Descriptive Statistics N Mean StDev SE Mean 900 3.4410 0.4393 0.0146 u: mean of GPA Test Null hypothesis Ho: J = 3.41 Alternative hypothesis H: p > 3.41 T-Value P-Value 2.12 0.0172. Using the Survey Spring 2020 data set, we test the hypothesis that the proportion of Math 147 students who are vegetarians is not equal to the national rate of 7.5% who consider themselves vegetarians. The Minitab Output is below Test and CI for One Proportion: Veg Method Event: Veg = y P: proportion where Veg = y Normal approximation method is used for this analysis. Descriptive Statistics N Event Sample p 900 85 0.094444 Test Null hypothesis Ho: p = 0.075 Alternative hypothesis Hi: p = 0.075
Step by Step Solution
There are 3 Steps involved in it

Get step-by-step solutions from verified subject matter experts