

Question: 1- Using the table above, Plot Portfolio Expected Return and Portfolio Standard Deviation and mark the efficient frontier. 2- Based on expected returns of the
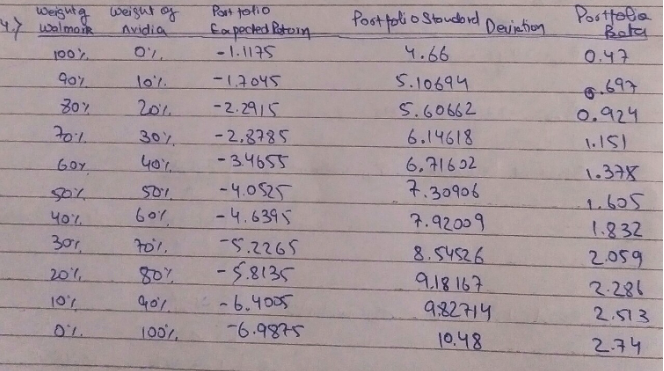
1- Using the table above, Plot Portfolio Expected Return and Portfolio Standard Deviation and mark the
efficient frontier.
2- Based on expected returns of the two companies, betas of the two companies, and the
reward-to-risk ratio, find the risk-free rate.
I need these answers! I would appreciate the help!
100 01 6.69 S. 60662 6.14618 6,31652 o.921 .IS 1.3x 2,373S 30%, o -346ST 6or-4.639 .9209 .832 2oS $.2265 -5.813 Q18 16 2.23 2S13 4827| 0,48 1o'r 234
Step by Step Solution
There are 3 Steps involved in it
1 Expert Approved Answer
Step: 1 Unlock

Question Has Been Solved by an Expert!
Get step-by-step solutions from verified subject matter experts
Step: 2 Unlock
Step: 3 Unlock