

Question: 1. Using the unit normal table (Appendix C-Table C.1), find the proportion under the standard normal curve that lies to the right of each
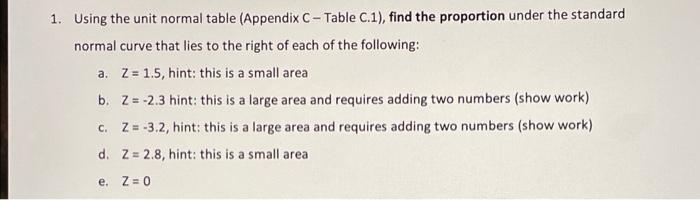
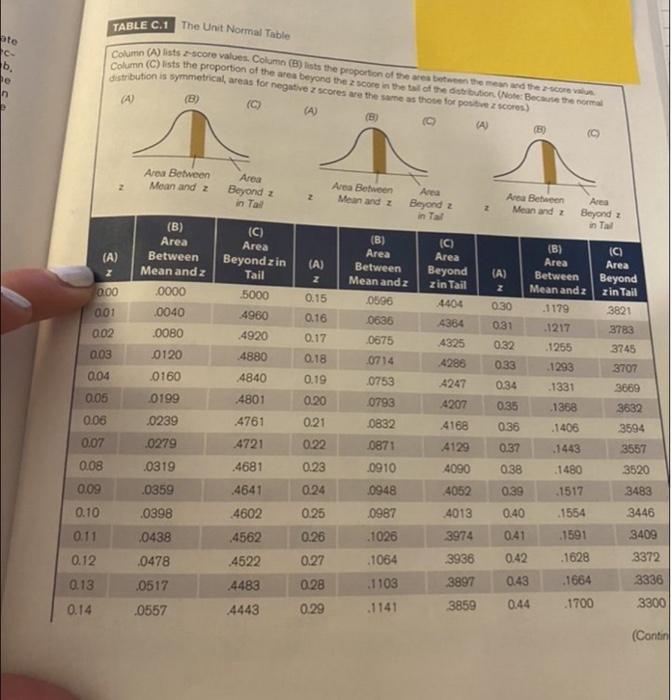
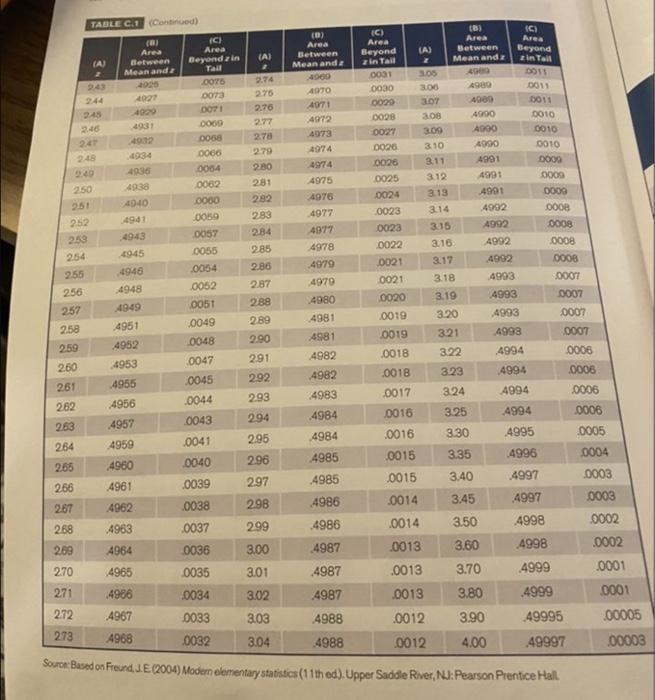
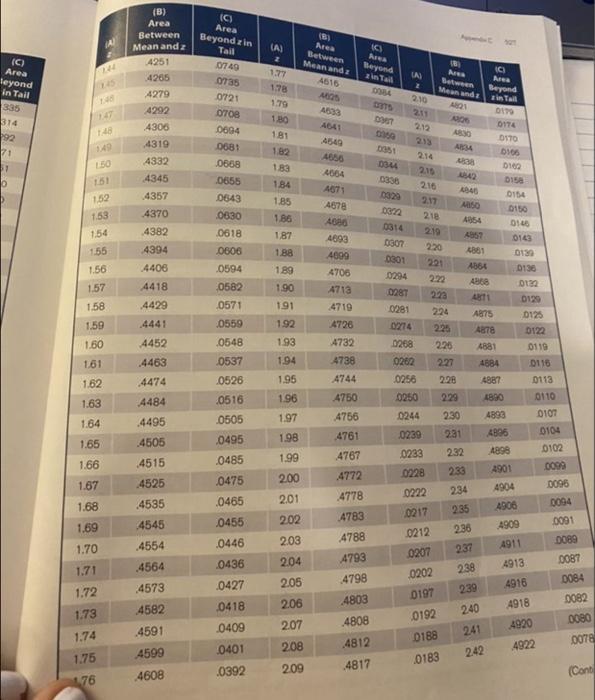
1. Using the unit normal table (Appendix C-Table C.1), find the proportion under the standard normal curve that lies to the right of each of the following: a. Z= 1.5, hint: this is a small area b. Z= -2.3 hint: this is a large area and requires adding two numbers (show work) c. Z= -3.2, hint: this is a large area and requires adding two numbers (show work) d. Z= 2.8, hint: this is a small area. e. Z=0 ate TABLE C.1 The Unit Normal Table Column (A) lists z-score values Column (B) lists the proportion of the area between the mean and the 2-score valu Column (C) lists the proportion of the area beyond the 2 score in the tail of the distribution (Note: Because the normal distribution is symmetrical, areas for negative z scores are the same as those for positive z scores) (A) C (A) Z 0.00 0.01 0.02 0.03 0.04 0.05 0.06 0.07 0.08 0.09 0.10 0.11 0.12 0.13 0.14 (A) (B) Area Between Mean and z (B) Area Between Mean and z 0000 0040 .0080 0120 0160 0199 0239 0279 0319 0359 0398 0438 0478 0517 0557 Area Beyond z in Tail (C) Area Beyond zin Tail 5000 4960 4920 4880 4840 4801 4761 4721 4681 4641 4602 4562 4522 4483 4443 2 (A) Z 0.15 0.16 0.17 0.18 0.19 0.20 0.21 0.22 0.23 0.24 0.25 0.26 0.27 0.28 0.29 Area Between Mean and z Area Beyond z in Tal (B) Area Between Mean and z 0596 0636 0675 0714 0753 0793 0832 0871 0910 0948 0987 1026 1064 1103 1141 2 (B) Area Between Mean and z (C) Area Beyond (A) z in Tail Z 4404 0.30 4364 0.31 4325 0.32 4286 0.33 4247 0.34 4207 0.35 4168 0.36 4129 0.37 4090 0.38 4052 0.39 4013 0.40 3974 041 3936 0.42 3897 0.43 3859 0.44 1179 1217 1255 1293 1331 1368 B Area Beyond z in Tail (B) Area Between Mean and z 1406 1443 1480 1517 1554 1591 1628 1664 1700 (C) Area Beyond z in Tail 3821 3783 3745 3707 3669 3632 3594 3557 3520 3483 3446 3409 3372 3336 3300 (Contin TABLE C.1 (Continued) 2.46 247 2.50 251 2.52 248 2.49 2.53 254 2.55 256 243 2.44 245 2.57 (A) 2.58 2.59 2.60 261 2.62 2.63 264 2.65 2.66 2.67 2.68 2.69 2.70 271 2.72 2.73 Beyond z in Tail 0076 0073 0071 0009 0066 0066 0064 0062 0000 0050 0057 0055 0054 0052 0051 0049 0048 0047 0045 0044 0043 0041 4984 0040 4985 0039 4985 0038 4986 4963 0037 4986 4964 0036 4987 4965 0035 4987 4966 0034 4987 4967 0033 4988 4968 0032 4988 Source: Based on Freund, J.E. (2004) Modem elementary statistics (11th ed). Upper Saddle River, NJ: Pearson Prentice Hall 4025 4027 4929 4931 4932 4934 4936 4938 4040 4941 4943 4945 4946 4948 4949 4951 4952 4953 4955 4956 4957 4959 4960 4961 4962 (8) Area Between Mean and z (C) Area (A) 2.74 2.75 2.76 2.77 278 2.79 2.80 281 2.82 2.83 2.84 2.85 2.86 2.87 2.88 2.89 (B) Area Between Mean and z 2.90 2.91 2.92 2.93 294 2.95 2.96 2.97 2.98 2.99 3.00 3.01 3.02 3.03 3.04 4000 4970 4971 4972 4973 4974 4974 4975 4976 4977 4977 4978 4979 4979 4980 4981 4981 (C) Area 4982 4982 4983 4984 Beyond z in Tail 0031 0030 0029 (A) 0028 0027 0026 0026 0025 (8) Area Between Mean and z 3.05 3.00 3.07 4980 4980 4989 3.08 3.09 3.10 3.11 3.12 0024 3.13 0023 3.14 0023 3.15 0022 3.16 0021 3.17 0021 3.18 0020 3.19 0019 3.20 0019 3.21 0018 3.22 0018 3.23 0017 3.24 0016 3.25 0016 3.30 0015 3.35 0015 3.40 0014 3.45 0014 3.50 0013 3.60 0013 3.70 0013 3.80 0012 3.90 0012 4.00 4900 4900 4900 4991 4991 4991 (C) Area Beyond zin Tail 0011 0011 0011 4992 4992 4992 4992 4993 4993 4993 4993 0010 0010 0010 0009 4994 4994 4994 4994 4995 4996 4997 0009 0009 0008 4997 4998 4998 0008 0008 0008 0007 0007 0007 0007 0006 4999 4999 49995 49997 0006 0006 0006 0005 0004 0003 0003 0002 0002 0001 0001 00005 00003 (C) Area leyond in Tail 335 314 92 71 51 O 145 148 147 148 1.49 1.50 151 1.52 1.53 1.75 476 1.54 1.55 1.56 1.57 1.58 1.59 1.70 1.71 1.72 1.73 1.74 1.60 1,61 1.62 1.63 1.64 1.65 1.66 1.67 1.68 1.69 (B) Area Between Mean andz 4251 4265 4279 4292 4306 4319 4332 4345 4357 4370 4382 4394 4406 4418 4429 4441 4452 4463 4474 4484 4495 4505 4515 4525 4535 4545 4554 4564 4573 4582 4591 4599 4608 (C) Area Beyond zin Tail 0749 0735 0721 0708 0604 0681 0668 0655 0643 0630 0618 0606 0594 0582 0571 0559 0548 0537 0526 0516 0505 0495 0485 0475 0465 0455 0446 0436 0427 0418 0409 0401 0392 (A) 1.77 1.78 1.79 1.80 1.81 1.82 1.83 1.84 1.85 1.86 1,87 1.88 1.89 1.90 1.91 1.92 1.93 1.94 1.95 1.96 1.97 1.98 1.99 2.00 2.01 2.02 2.03 2.04 2.05 2.06 2.07 2.08 2.09 (8) Area Between Mean and z 4616 4625 4633 4641 A649 4656 A064 A671 A678 4686 4693 4009 4706 4713 4719 4726 4732 4738 A744 4750 4766 4761 4767 4772 4778 4783 4788 (C) Area Beyond z in Tail 0084 4793 4798 4803 4808 4812 4817 D375 0967 0359 0351 10344 0336 0329 0322 (A) 2.10 2.11 2.12 2.13 2.14 2.10 0268 0262 0256 0250 2.16 2.17 2.18 2.19 (8) Area Between Mean and z A821 220 Appon C 221 0197 0192 0188 0183 A326 A830 ABBA 4838 A842 AB46 A850 0314 0307 0301 0294 2:22 0287 2.23 0281 224 0274 2.25 226 2.27 4684 2:28 4887 2.29 4890 0244 2.30 4893 0239 2.31 A896 0233 0228 0222 234 0217 2.35 0212 2.36 0207 2.37 2.38 0202 239 240 241 242 4857 2.32 2.33 4861 A864 5 Area Beyond zin Tail A868 ABT1 4875 101 0179 0174 0170 A878 4881 0106 0162 0158 0154 0150 0146 0143 0139 0136 0132 0129 0125 0122 0119 0116 0113 0110 4898 4901 4904 4906 4909 4911 4913 4916 4918 4920 4922 0107 0104 0102 0099 0096 0094 0091 0089 0087 0084 0082 0080 0078 (Cont
Step by Step Solution
3.38 Rating (145 Votes )
There are 3 Steps involved in it

Get step-by-step solutions from verified subject matter experts