

Question: 1. Using the World Bank's World Development Indicators (WDI) database (httpvt'databanl-tworldbankorg download 3 variables widi country as the unit of observation that you believe are
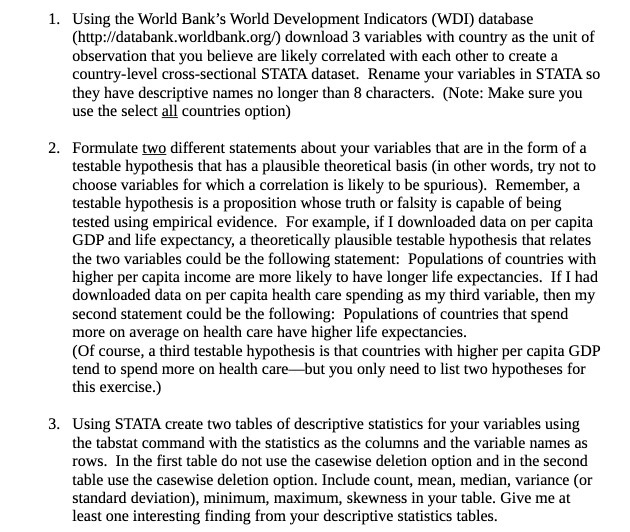
1. Using the World Bank's World Development Indicators (WDI) database (httpvt'databanl-tworldbankorg download 3 variables widi country as the unit of observation that you believe are likely correlated with each other to create a country-level cross-sectional STATA dataseL Rename your variables in STATA so they have descriptive names no longer than 3 characters. (Note: Make sure you use the select counuies option] 2. Formulate different statements about your variables that are in the form of a testable hypothesis that has a plausible theoretical basis (in other words, try not to choose variables for which a correlation is likely to be spurious). Remember, a testable hypothesis is a proposition whose truth or falsity is capable of being tested using empirical evidence. For example, if] downloaded data on per capita GDP and life expectancy, a theoretically plausible testable hypothesis that relates the two variables could be the following statement: Populations of countries with higher per capita income are more likely to have longer life expectancies. If I had downloaded data on per capita health care spending as my third variable. then my second statement could be the following: Populations of countries that spend more on average on health care have higher life expectancies. (Of course, a third testable hypothesis is that counuies with higher per capita GDP tend to spend more on health carebut you only need to list two hypotheses for this exercise.) 3. Using STATA create two tables of descriptive statistics for your variables using the tabstat command with the statistics as the columns and the variable names as rows. In the rst table do not use the casewise deletion option and in the second table use the casewise deletion option. Include count, mean, median, variance (or standard deviation), minimum, maximum, skewness in your table. Give me at least one interesting nding from your descriptive statistics tables
Step by Step Solution
There are 3 Steps involved in it

Get step-by-step solutions from verified subject matter experts