

Question: 1. Using your new cost system design, calculate new total per unit product costs for the valves, pumps and flow controllers? 2. Compare the costs
1. Using your new cost system design, calculate new total per unit product costs for the valves, pumps and flow controllers? 2. Compare the costs that you calculate to the standard unit products costs in Exhibit 2. What causes different product costing methods to produce such different results?
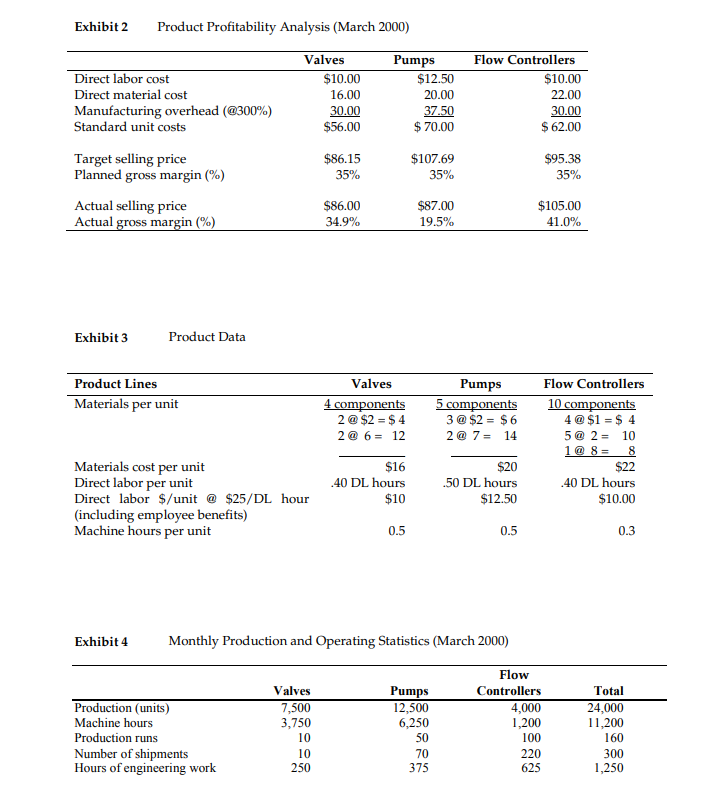
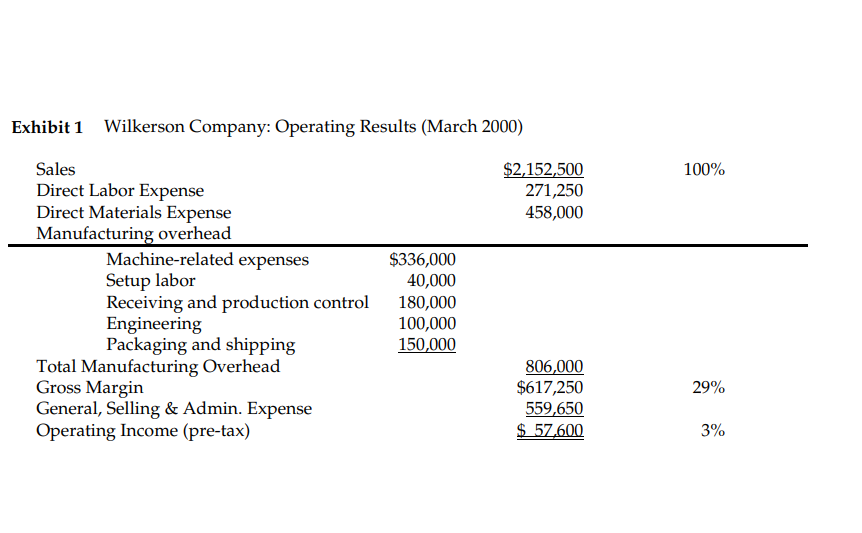
Exhibit 2 Product Profitability Analysis (March 2000) Valves $10.00 16.00 30.00 $56.00 Pumps $12.50 20.00 37.50 $ 70.00 Flow Controllers $10.00 22.00 30.00 $ 62.00 Direct labor cost Direct material cost Manufacturing overhead (@300%) Standard unit costs Target selling price Planned gross margin (%) Actual selling price Actual gross margin (%) $86.15 35% $107.69 35% $95.38 35% $86.00 34.9% $87.00 19.5% $105.00 41.0% Exhibit 3 Product Data Product Lines Materials per unit Valves 4 components 2 @ $2 = $4 2 @ 6 = 12 Pumps 5 components 3 @ $2 = $6 2 @ 7 = 14 Flow Controllers 10 components 4 @ $1 = $ 4 5@ 2 = 10 1 @ 8= 8 $22 .40 DL hours $10.00 Materials cost per unit Direct labor per unit Direct labor $/unit @ $25/DL hour (including employee benefits) Machine hours per unit $16 .40 DL hours $10 $20 .50 DL hours $12.50 0.5 0.5 0.3 Exhibit 4 Monthly Production and Operating Statistics (March 2000) Production (units) Machine hours Production runs Number of shipments Hours of engineering work Valves 7,500 3,750 10 10 250 Pumps 12,500 6,250 50 70 375 Flow Controllers 4,000 1,200 100 220 625 Total 24,000 11,200 160 300 1,250 Wilkerson Company: Operating Results (March 2000) 100% $2,152,500 271,250 458,000 Sales Direct Labor Expense Direct Materials Expense Manufacturing overhead Machine-related expenses Setup labor Receiving and production control Engineering Packaging and shipping Total Manufacturing Overhead Gross Margin General, Selling & Admin. Expense Operating Income (pre-tax) $336,000 40,000 180,000 100,000 150,000 29% 806,000 $617,250 559,650 $ 57,600 3%
Step by Step Solution
There are 3 Steps involved in it

Get step-by-step solutions from verified subject matter experts