

Question: 1. Using your standard curve, the absorbance values provided in the Excel sheet, and the amount of time the gels were in each vial (also
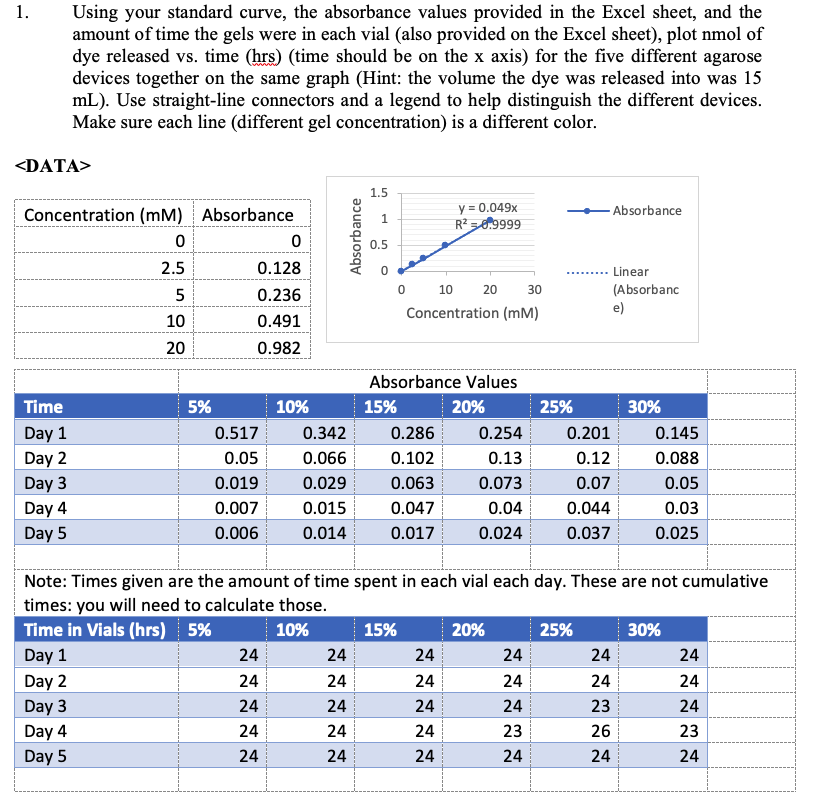
1. Using your standard curve, the absorbance values provided in the Excel sheet, and the amount of time the gels were in each vial (also provided on the Excel sheet), plot nmol of dye released vs. time (hrs) (time should be on the x axis) for the five different agarose devices together on the same graph (Hint: the volume the dye was released into was 15 mL). Use straight-line connectors and a legend to help distinguish the different devices. Make sure each line (different gel concentration) is a different color. 1.5 y = 0.049x R = 0.9999 Absorbance 1 Absorbance 0.5 Concentration (mm) Absorbance 0 0 2.5 0.128 5 0.236 10 0.491 20 0.982 0 10 20 30 Linear (Absorbanc e) Concentration (MM) Time Day 1 Day 2 Day 3 Day 4 Day 5 5% 0.517 0.05 0.019 0.007 0.006 10% 0.342 0.066 0.029 0.015 0.014 Absorbance Values 15% 20% 0.286 0.254 0.102 0.13 0.063 0.073 0.047 0.04 0.017 0.024 25% 0.201 0.12 0.07 0.044 0.037 30% 0.145 0.088 0.05 0.03 0.025 30% 24 24 24 24 Note: Times given are the amount of time spent in each vial each day. These are not cumulative times: you will need to calculate those. Time in Vials (hrs) 5% 10% 15% 20% 25% Day 1 24 24 Day 2 24 24 24 24 24 24 Day 3 24 24 24 24 24 24 23 Day 5 24 24 24 24 24 24 23 Day 4 24 24 23 26 1. Using your standard curve, the absorbance values provided in the Excel sheet, and the amount of time the gels were in each vial (also provided on the Excel sheet), plot nmol of dye released vs. time (hrs) (time should be on the x axis) for the five different agarose devices together on the same graph (Hint: the volume the dye was released into was 15 mL). Use straight-line connectors and a legend to help distinguish the different devices. Make sure each line (different gel concentration) is a different color. 1.5 y = 0.049x R = 0.9999 Absorbance 1 Absorbance 0.5 Concentration (mm) Absorbance 0 0 2.5 0.128 5 0.236 10 0.491 20 0.982 0 10 20 30 Linear (Absorbanc e) Concentration (MM) Time Day 1 Day 2 Day 3 Day 4 Day 5 5% 0.517 0.05 0.019 0.007 0.006 10% 0.342 0.066 0.029 0.015 0.014 Absorbance Values 15% 20% 0.286 0.254 0.102 0.13 0.063 0.073 0.047 0.04 0.017 0.024 25% 0.201 0.12 0.07 0.044 0.037 30% 0.145 0.088 0.05 0.03 0.025 30% 24 24 24 24 Note: Times given are the amount of time spent in each vial each day. These are not cumulative times: you will need to calculate those. Time in Vials (hrs) 5% 10% 15% 20% 25% Day 1 24 24 Day 2 24 24 24 24 24 24 Day 3 24 24 24 24 24 24 23 Day 5 24 24 24 24 24 24 23 Day 4 24 24 23 26
Step by Step Solution
There are 3 Steps involved in it

Get step-by-step solutions from verified subject matter experts