

Question: 1. Visualize the function graph with Python and find points where the curve intersects the X axis. 2. Find roots of an equation using a
1. Visualize the function graph with Python and find points where the curve intersects the X axis.
2. Find roots of an equation using a Python implementation the fixed-point iterations method.
Note: Functions in tasks 1 and 2 are the same. So, the function graph built in task 1 can help with
defining an initial point for the fixed-point iteration method.
3. Resolve the system of linear algebraic equations using the Python Numpy library.
4. Approximate the definite integral using the Scipy Python library.
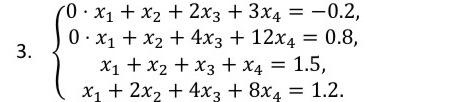
= 3. 10. X1 + x2 + 2x3 + 3x4 = -0.2, 0. X1 + x2 + 4x3 + 12x4 0.8, x1 + x2 + x3 + x4 = 1.5, X1 + 2x2 + 4x3 + 8x4 = 1.2. = =
Step by Step Solution
There are 3 Steps involved in it
1 Expert Approved Answer
Step: 1 Unlock

Question Has Been Solved by an Expert!
Get step-by-step solutions from verified subject matter experts
Step: 2 Unlock
Step: 3 Unlock