

Question: 1 Visualizing Error Functions (15%) Given the Figure 1 below, (a) Write down the Error functions for linear classification/regression and logistic regression in terms of
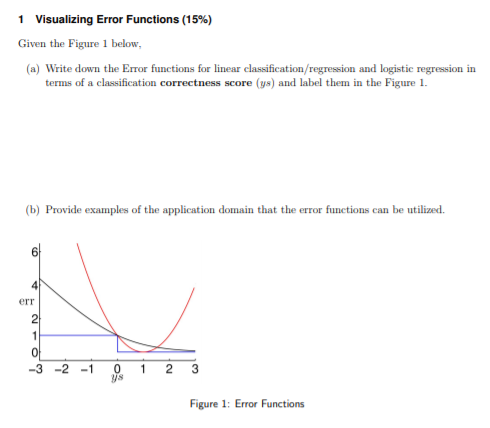
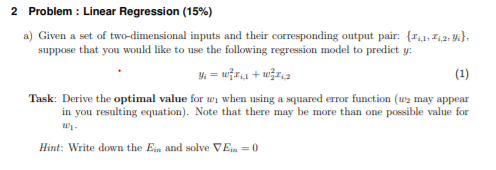
1 Visualizing Error Functions (15%) Given the Figure 1 below, (a) Write down the Error functions for linear classification/regression and logistic regression in terms of a classification correctness score (y) and label them in the Figure 1. (b) Provide examples of the application domain that the error functions can be utilized. err 2 1 0 -3 -2 -1 0 1 2 3 8 Figure 1: Error Functions 2 Problem: Linear Regression (15%) a) Given a set of two-dimensional inputs and their corresponding output pair: {I,1,1,2,y}, suppose that you would like to use the following regression model to predict y: yi = wffa+wa (1) Task: Derive the optimal value for w when using a squared error function (u may appear in you resulting equation). Note that there may be more than one possible value for Hint: Write down the Ein and solve VEin = 0 1 Visualizing Error Functions (15%) Given the Figure 1 below, (a) Write down the Error functions for linear classification/regression and logistic regression in terms of a classification correctness score (y) and label them in the Figure 1. (b) Provide examples of the application domain that the error functions can be utilized. err 2 1 0 -3 -2 -1 0 1 2 3 8 Figure 1: Error Functions 2 Problem: Linear Regression (15%) a) Given a set of two-dimensional inputs and their corresponding output pair: {I,1,1,2,y}, suppose that you would like to use the following regression model to predict y: yi = wffa+wa (1) Task: Derive the optimal value for w when using a squared error function (u may appear in you resulting equation). Note that there may be more than one possible value for Hint: Write down the Ein and solve VEin = 0
Step by Step Solution
There are 3 Steps involved in it

Get step-by-step solutions from verified subject matter experts