

Question: 1. What additional observations can we make in looking at this visualization in conjunction with Visualization and Description 3 (Comparison by Investment Type)? Number of
1. What additional observations can we make in looking at this visualization in conjunction with Visualization and Description 3 (Comparison by Investment Type)?
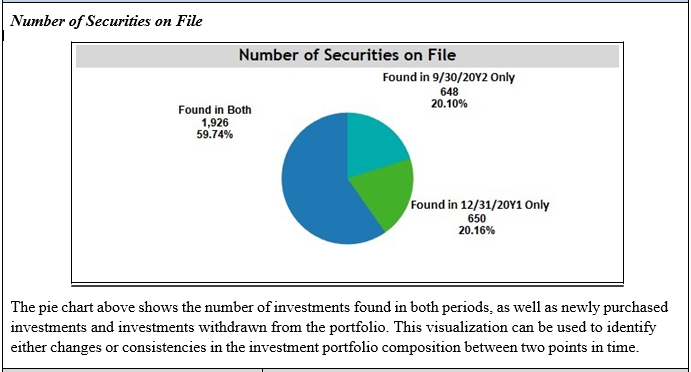
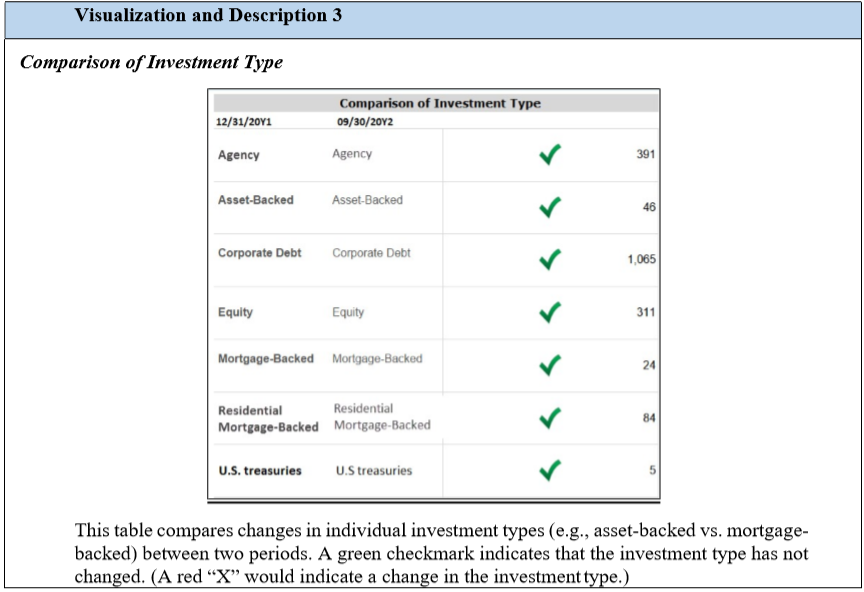
Number of Securities on File Number of Securities on File Found in 9/30/2022 Only Found in Both 20.10% 59.74% 648 1,926 Found in 12/31/20Y1 Only 650 20.16% The pie chart above shows the number of investments found in both periods, as well as newly purchased investments and investments withdrawn from the portfolio. This visualization can be used to identify either changes or consistencies in the investment portfolio composition between two points in time. Visualization and Description 3 Comparison of Investment Type Comparison of Investment Type 09/30/2012 12/31/2011 Agency Agency 391 Asset-Backed Asset-Backed 46 Corporate Debt Corporate Debt 1,065 Equity Equity 311 Mortgage-Backed Mortgage-Backed 24 Residential Residential Mortgage-Backed Mortgage-Backed 84 U.S. treasuries U.S treasures 5 This table compares changes in individual investment types (e.g., asset-backed vs. mortgage- backed) between two periods. A green checkmark indicates that the investment type has not changed. (A red X would indicate a change in the investment type.) Number of Securities on File Number of Securities on File Found in 9/30/2022 Only Found in Both 20.10% 59.74% 648 1,926 Found in 12/31/20Y1 Only 650 20.16% The pie chart above shows the number of investments found in both periods, as well as newly purchased investments and investments withdrawn from the portfolio. This visualization can be used to identify either changes or consistencies in the investment portfolio composition between two points in time. Visualization and Description 3 Comparison of Investment Type Comparison of Investment Type 09/30/2012 12/31/2011 Agency Agency 391 Asset-Backed Asset-Backed 46 Corporate Debt Corporate Debt 1,065 Equity Equity 311 Mortgage-Backed Mortgage-Backed 24 Residential Residential Mortgage-Backed Mortgage-Backed 84 U.S. treasuries U.S treasures 5 This table compares changes in individual investment types (e.g., asset-backed vs. mortgage- backed) between two periods. A green checkmark indicates that the investment type has not changed. (A red X would indicate a change in the investment type.)
Step by Step Solution
There are 3 Steps involved in it

Get step-by-step solutions from verified subject matter experts