Question: 1. What are some ways to improve a constraint? 2. What is the effect of cutting batch sizes? 3. The book makes the point that
1. What are some ways to improve a constraint?
2. What is the effect of cutting batch sizes?
3. The book makes the point that "Leaders and their priorities are a constraint within the organization". Do you agree or disagree? Support your position.
4. Can the Theory of Constraints (TOC) be applied to teams and team work as well as production or service systems? If so, what might be an example of constraining capability within a team?
5. On the image below, there is a discussion of reacting versus planning. In your organization, is there more reacting than planning? What is the consequence? How do you think that the script can be flipped?
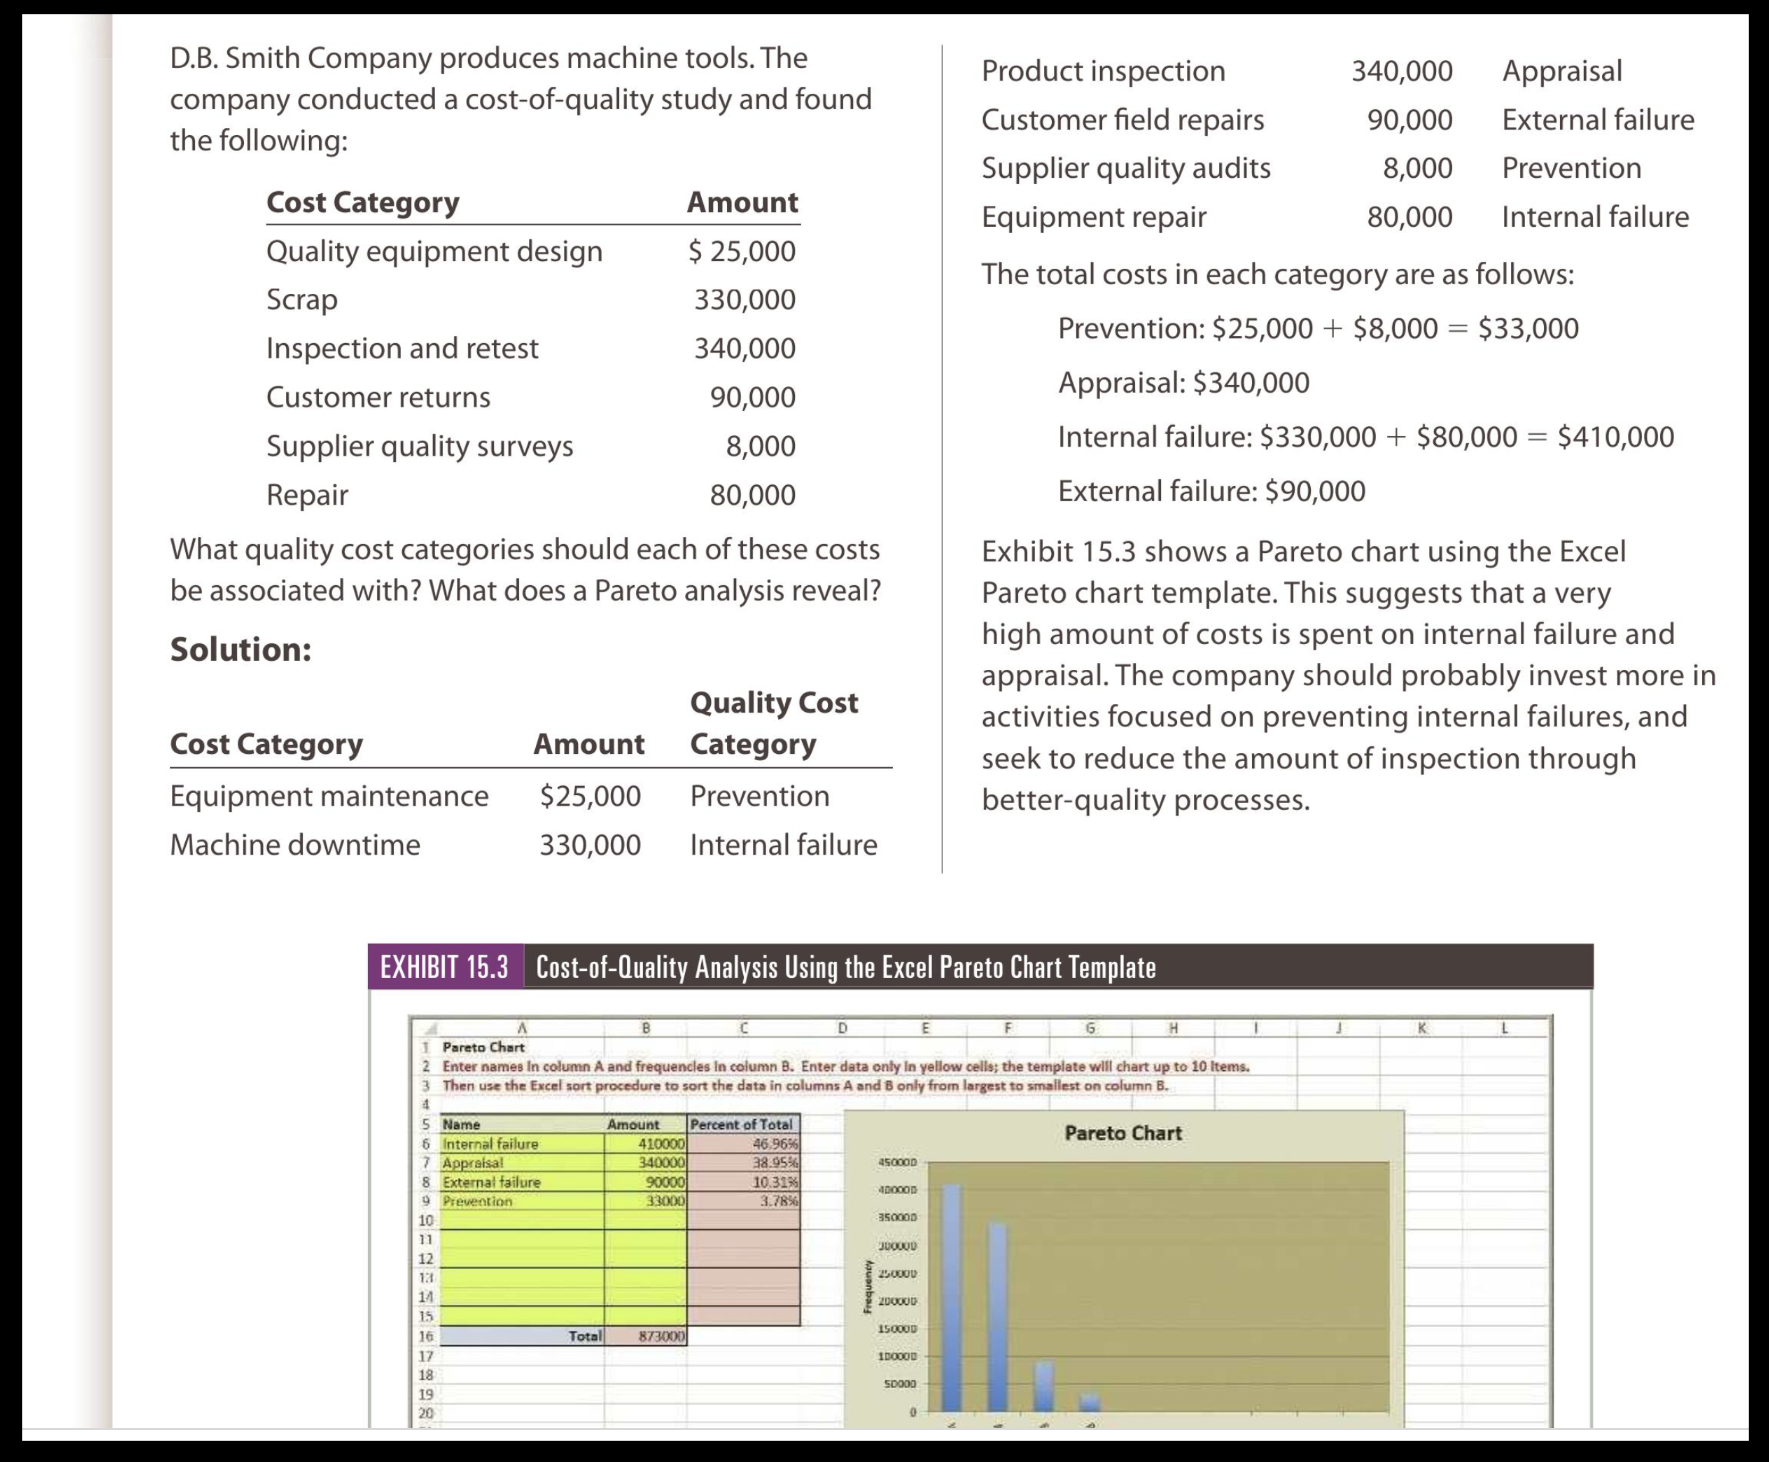
D.B. Smith Company produces machine tools. The Product inspection 340,000 Appraisal company conducted a cost-of-quality study and found Customer field repairs 90,000 External failure the following: Supplier quality audits 8,000 Prevention Cost Category Amount Equipment repair 80,000 Internal failure Quality equipment design $ 25,000 The total costs in each category are as follows: Scrap 330,000 340,000 Prevention: $25,000 + $8,000 = $33,000 Inspection and retest Customer returns 90,000 Appraisal: $340,000 Supplier quality surveys 8,000 Internal failure: $330,000 + $80,000 = $410,000 Repair 80,000 External failure: $90,000 What quality cost categories should each of these costs Exhibit 15.3 shows a Pareto chart using the Excel be associated with? What does a Pareto analysis reveal? Pareto chart template. This suggests that a very Solution: high amount of costs is spent on internal failure and appraisal. The company should probably invest more in Quality Cost activities focused on preventing internal failures, and Cost Category Amount Category seek to reduce the amount of inspection through Equipment maintenance $25,000 Prevention better-quality processes. Machine downtime 330,000 Internal failure EXHIBIT 15.3 Cost-of-Quality Analysis Using the Excel Pareto Chart Template Pareto Chart Enter names In column A and frequencies In column B. Enter data only In yellow cells; the template will chart up to 10 Items. 3 Then use the Excel sort procedure to sort the data in columns A and B only from largest to smallest on column B. 4 5 Name Amount Percent of Total 410000 46.969% Pareto Chart 6 Internal failure 7 Appraisal 340000 38.95%% 45000D 8 External failure 00006 10.31% 4DOOOD 9 Prevention 33000 3 7836 10 350000 11 $ 25000U 14 15 16 Total 873000 150000 17 1DOOOD 18 5DOO 19