Question: 1. What is Coca Cola's performance using financial statements, financial ratios, and valuation metrics? 2. What is Coca Cola's performance when compared with its peer
1. What is Coca Cola's performance using financial statements, financial ratios, and valuation metrics?
2. What is Coca Cola's performance when compared with its peer group? What is its growth prospects.
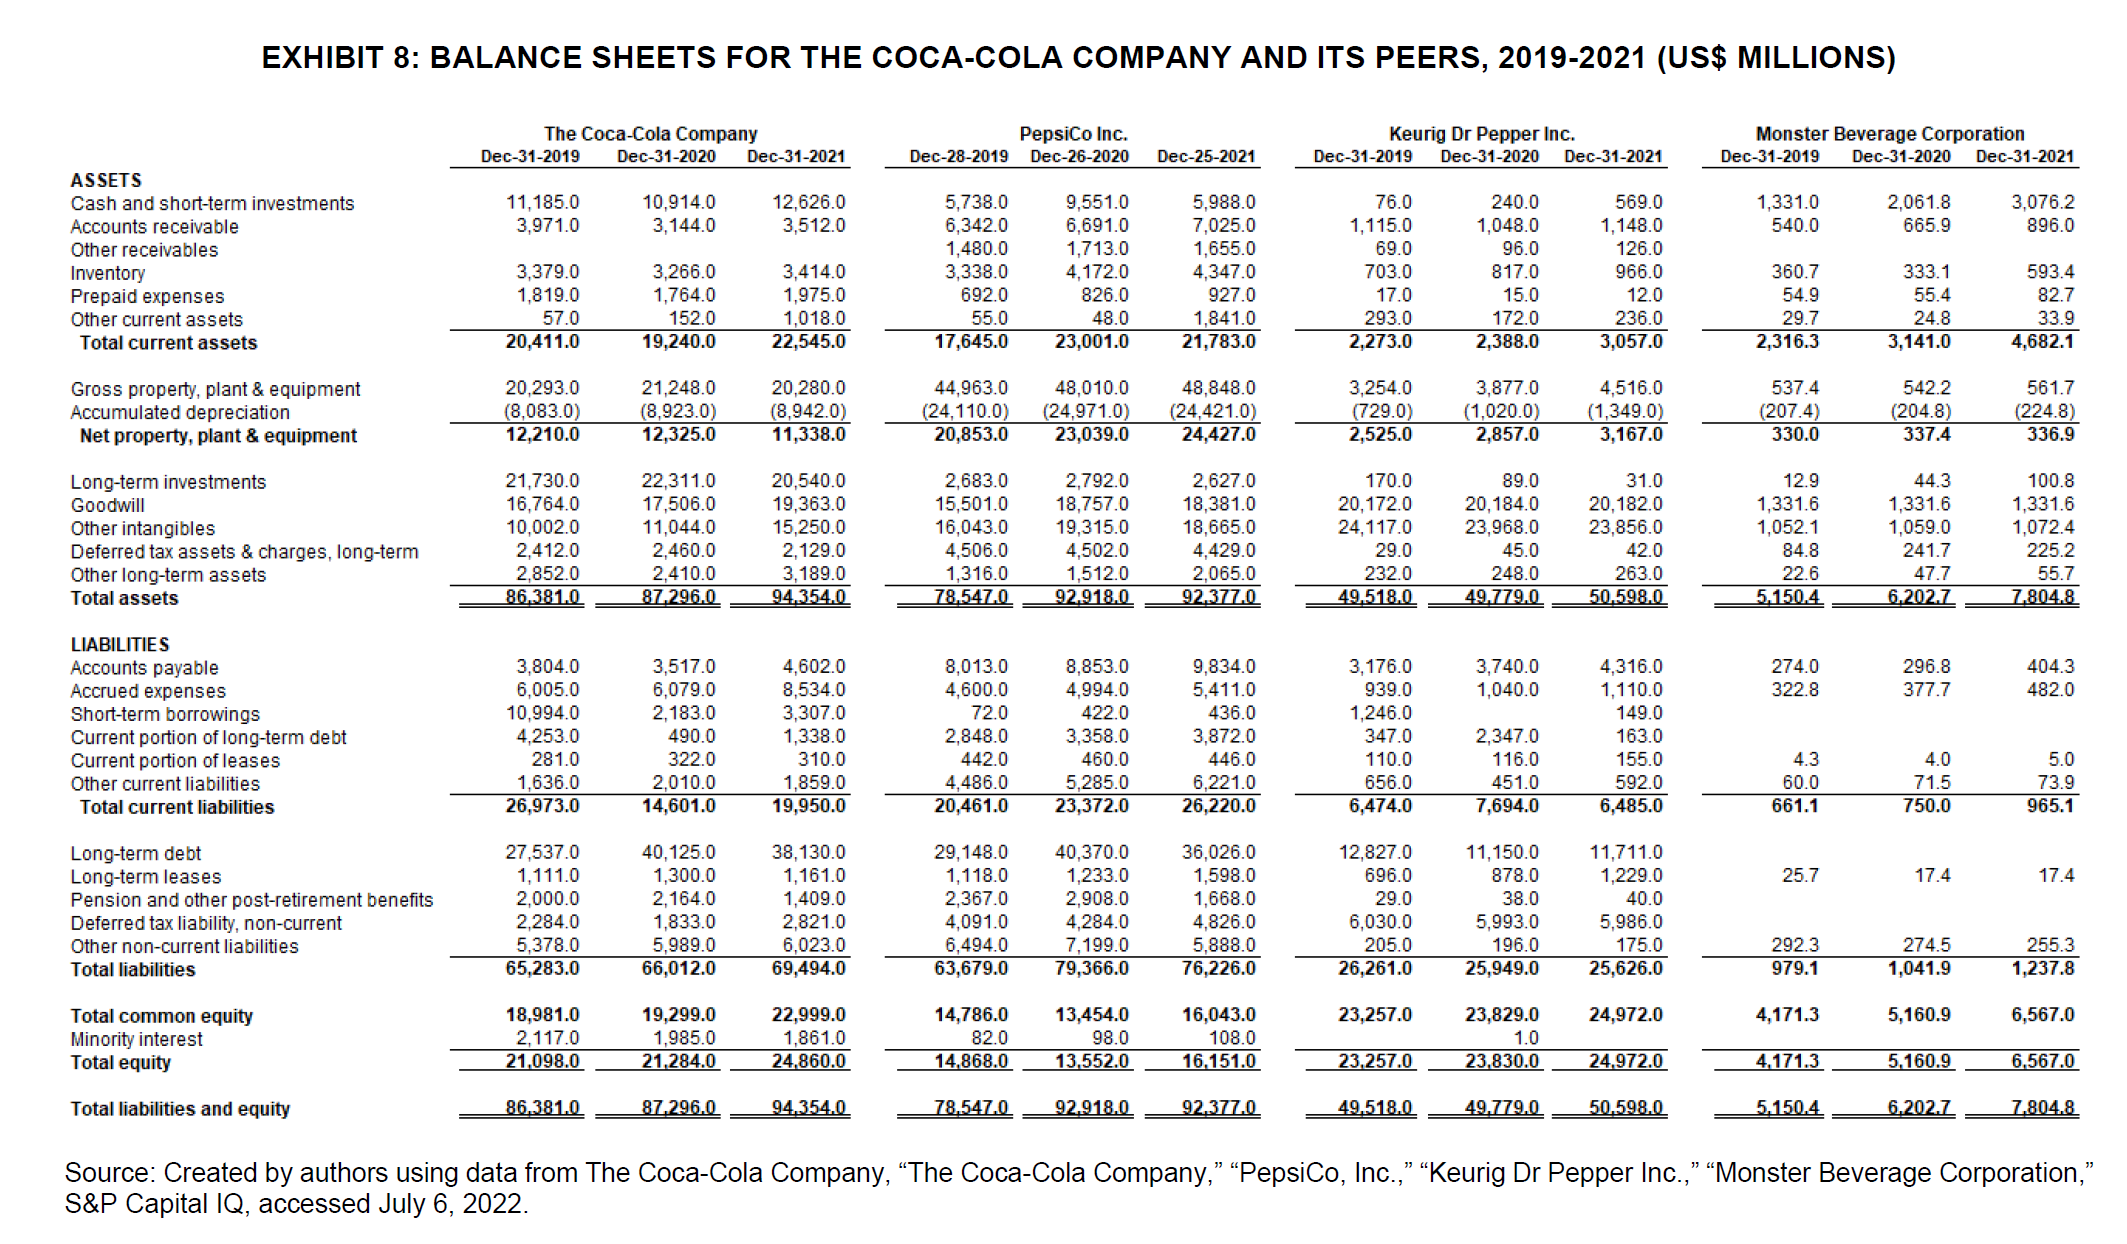
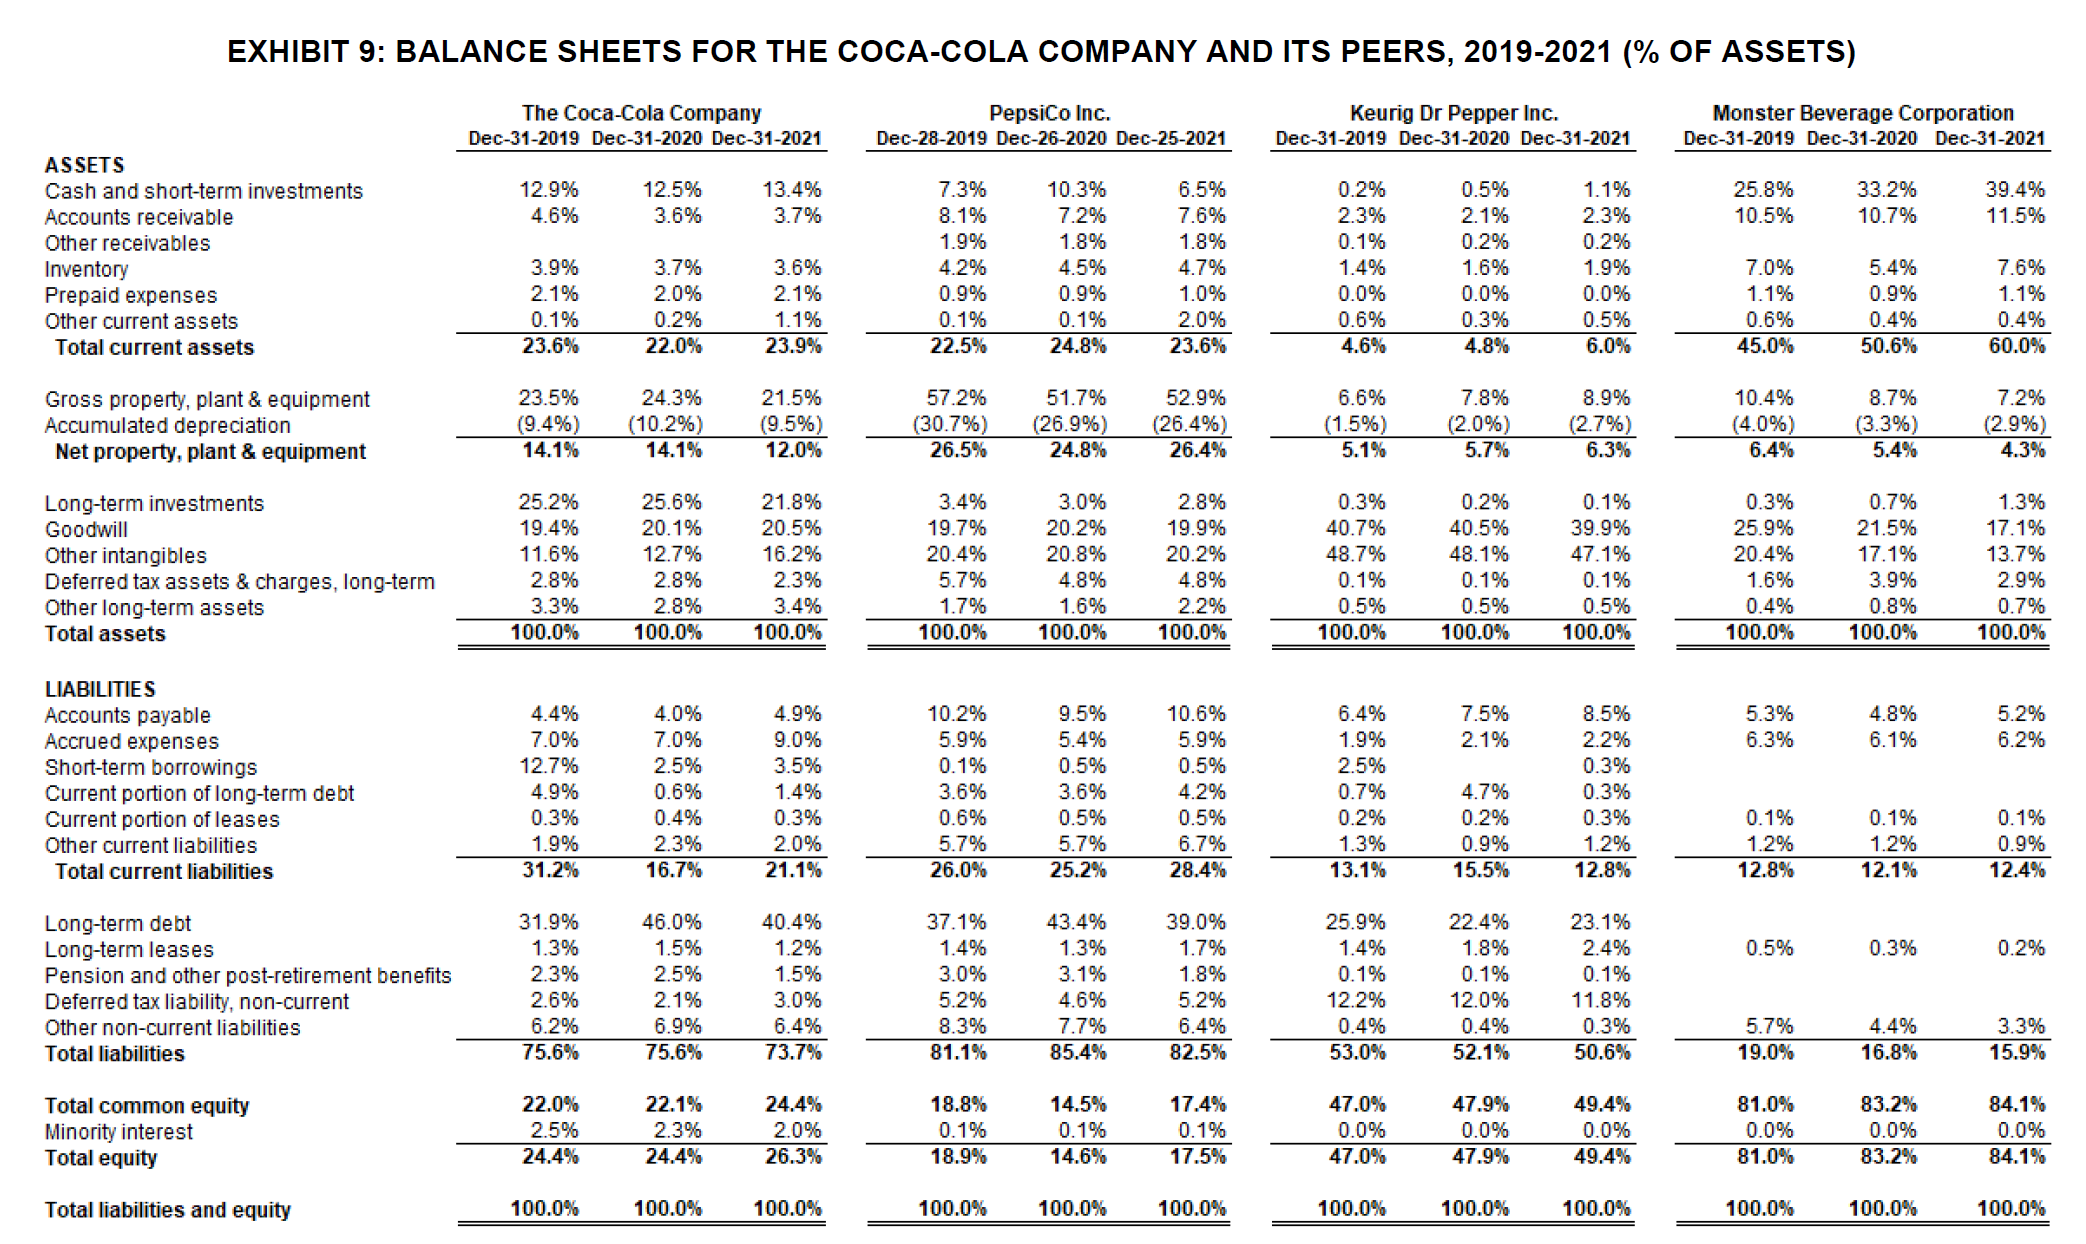
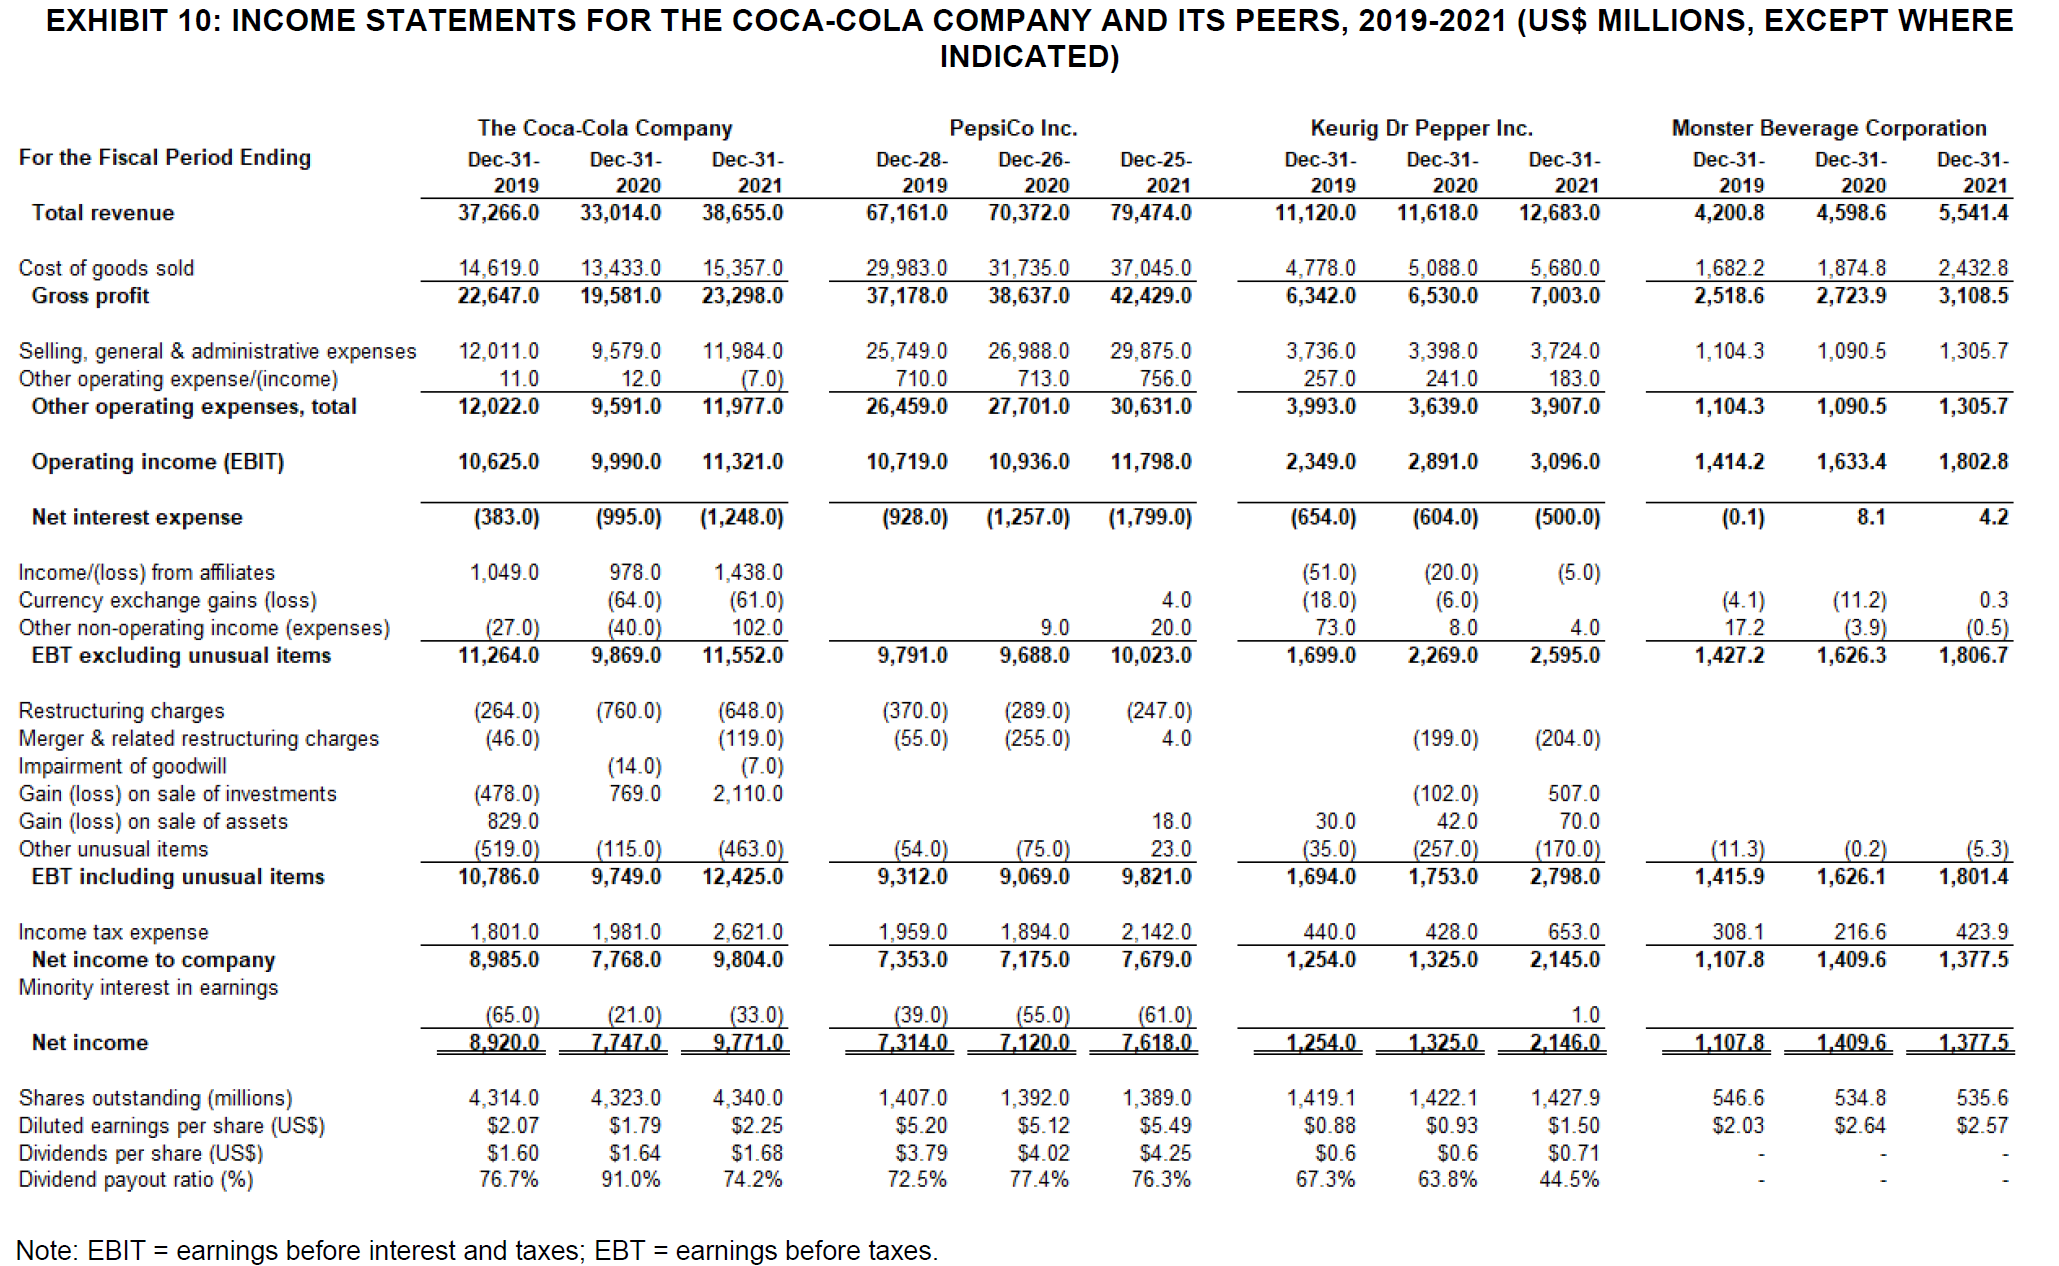
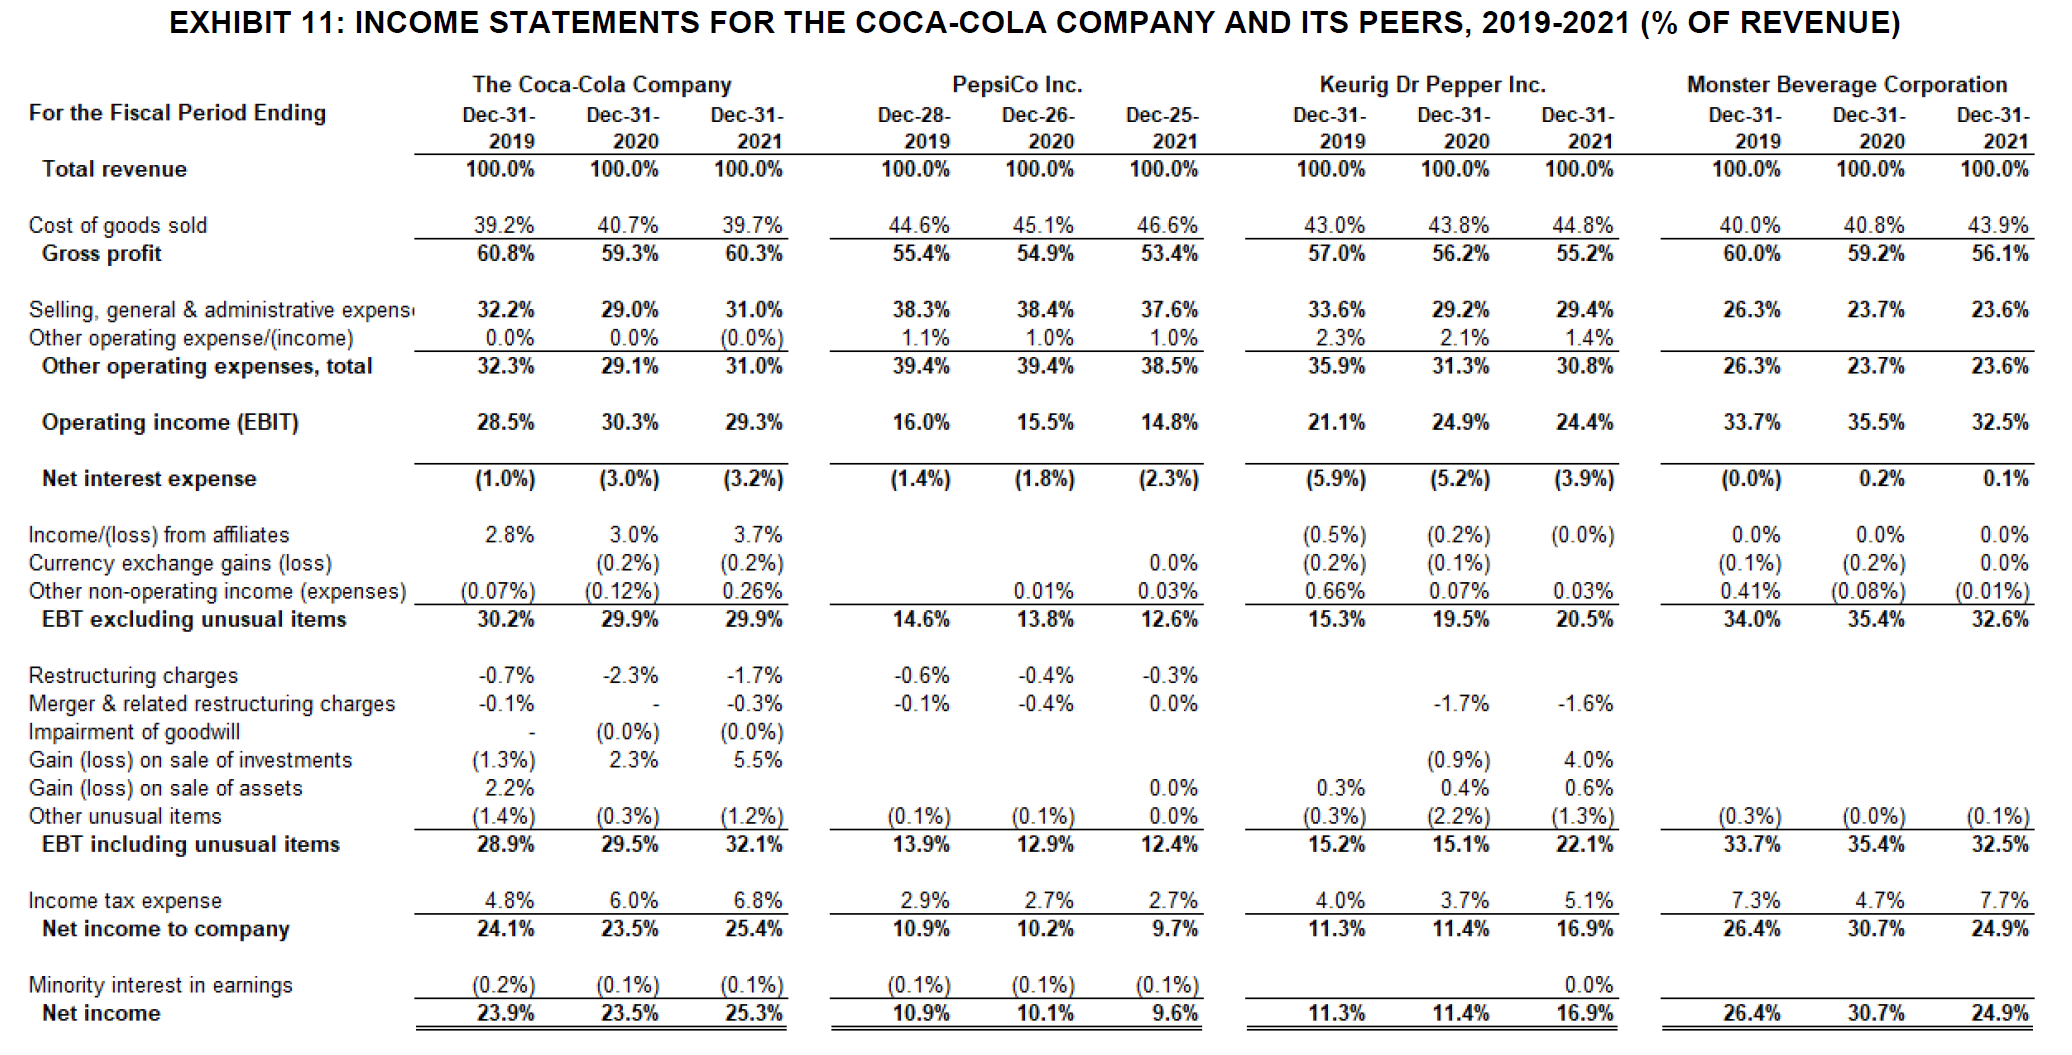
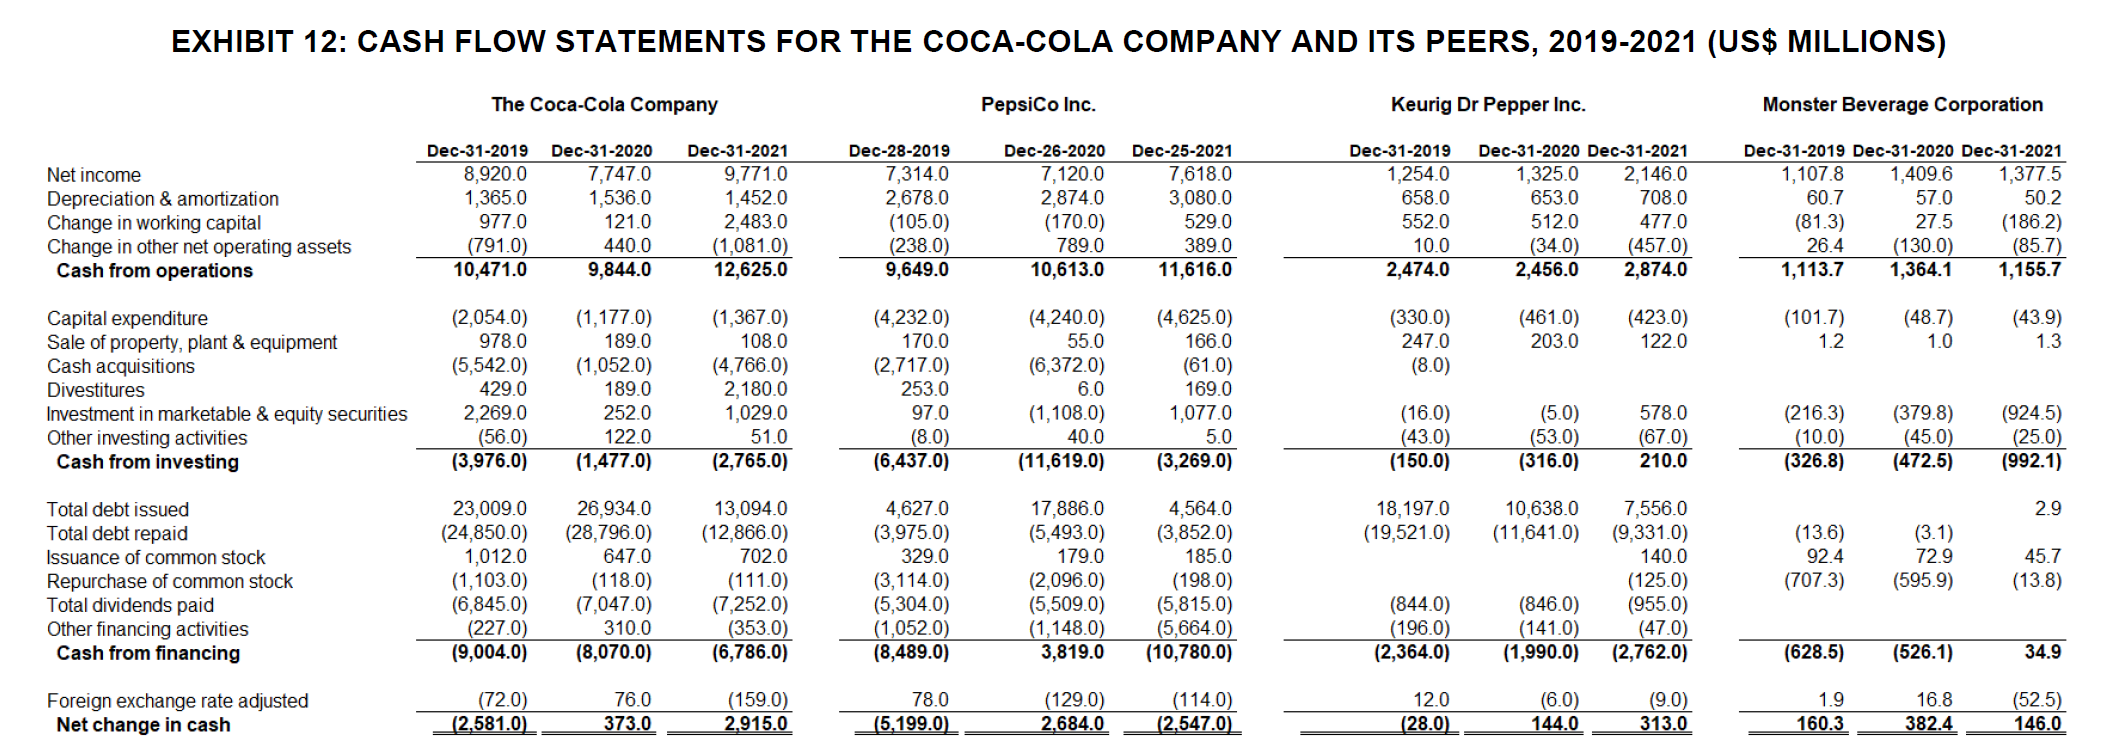
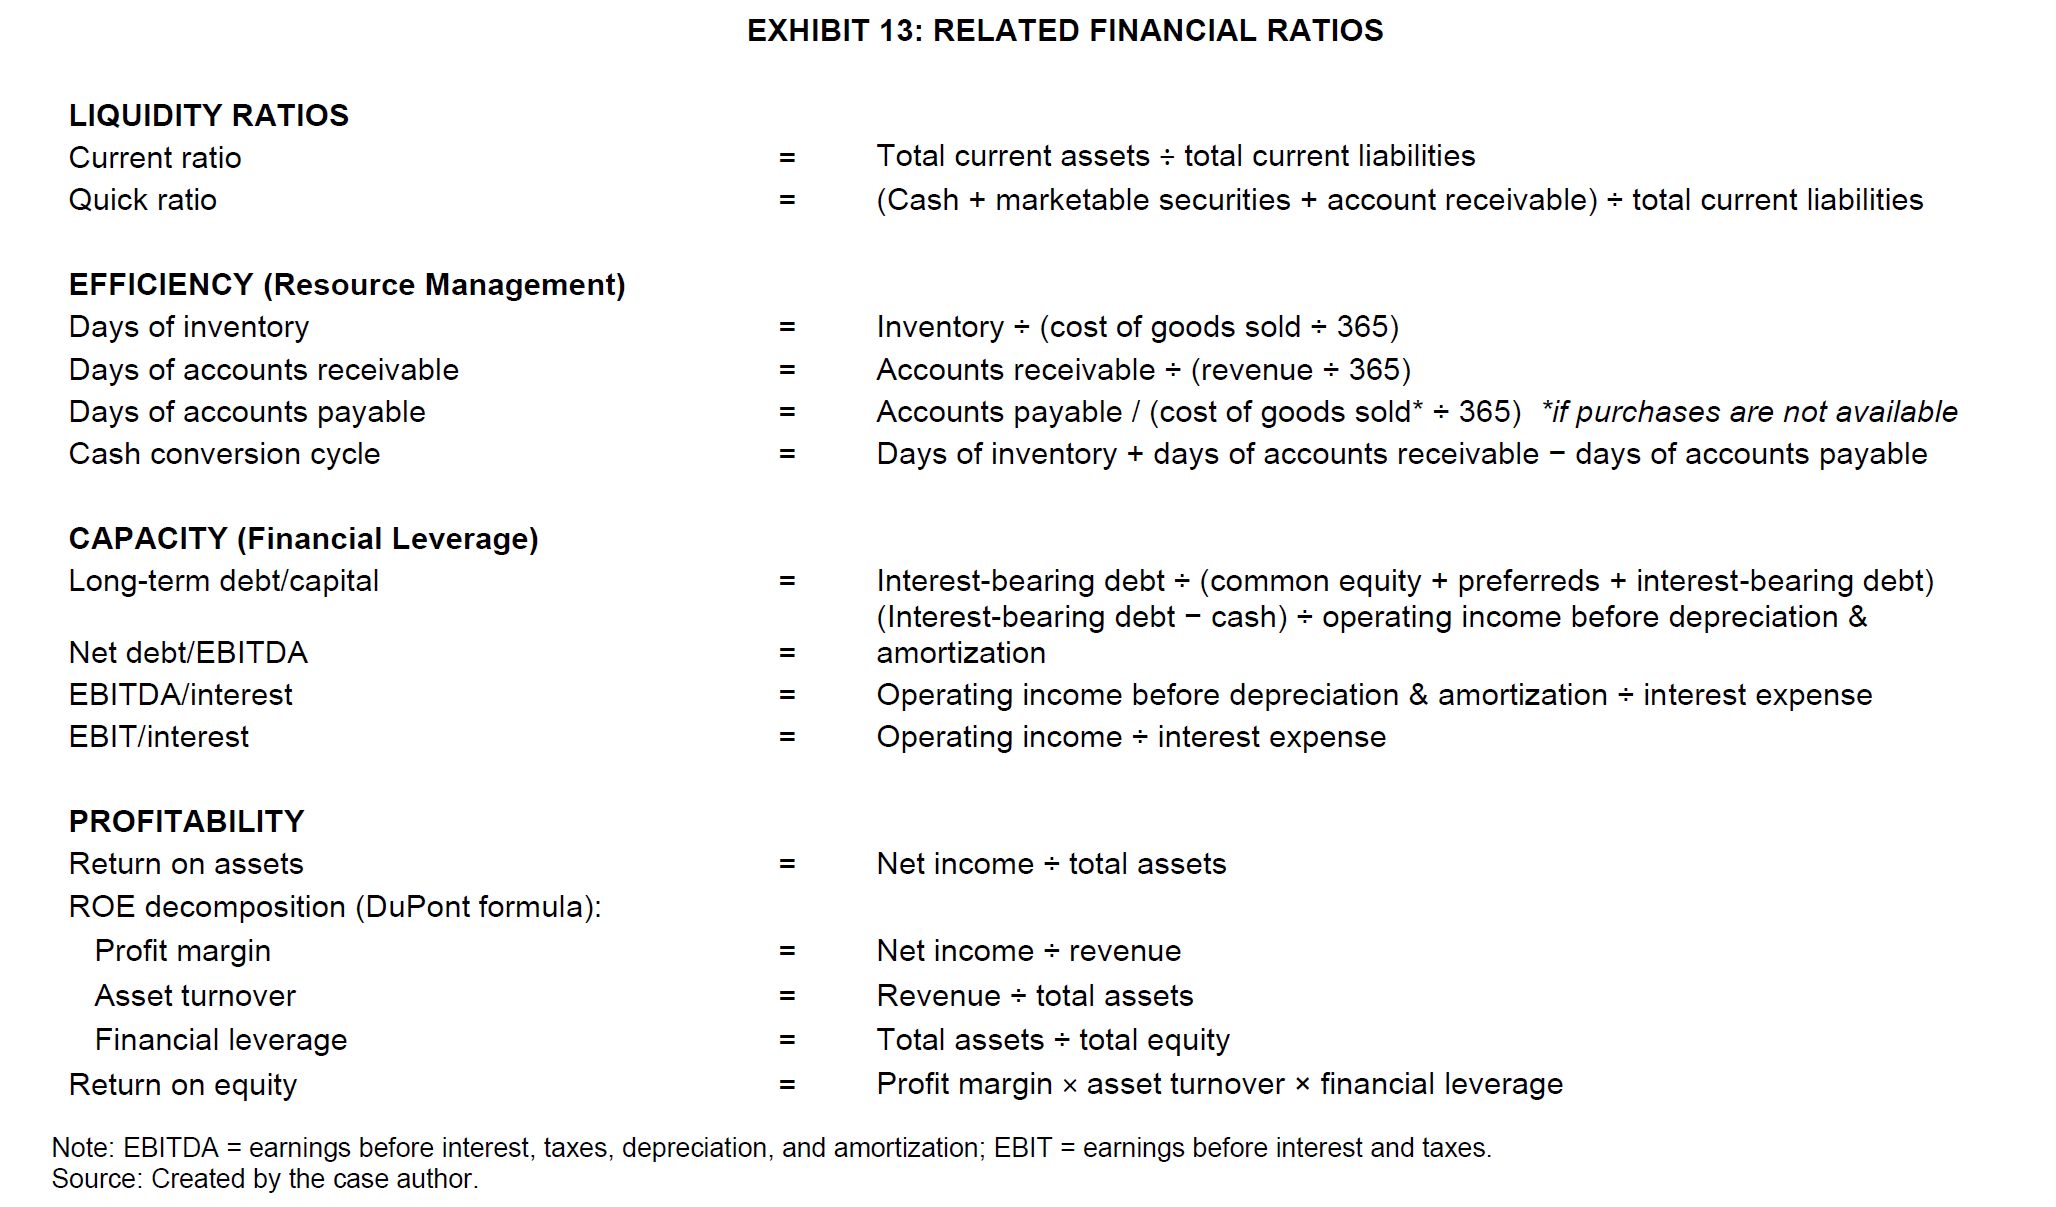
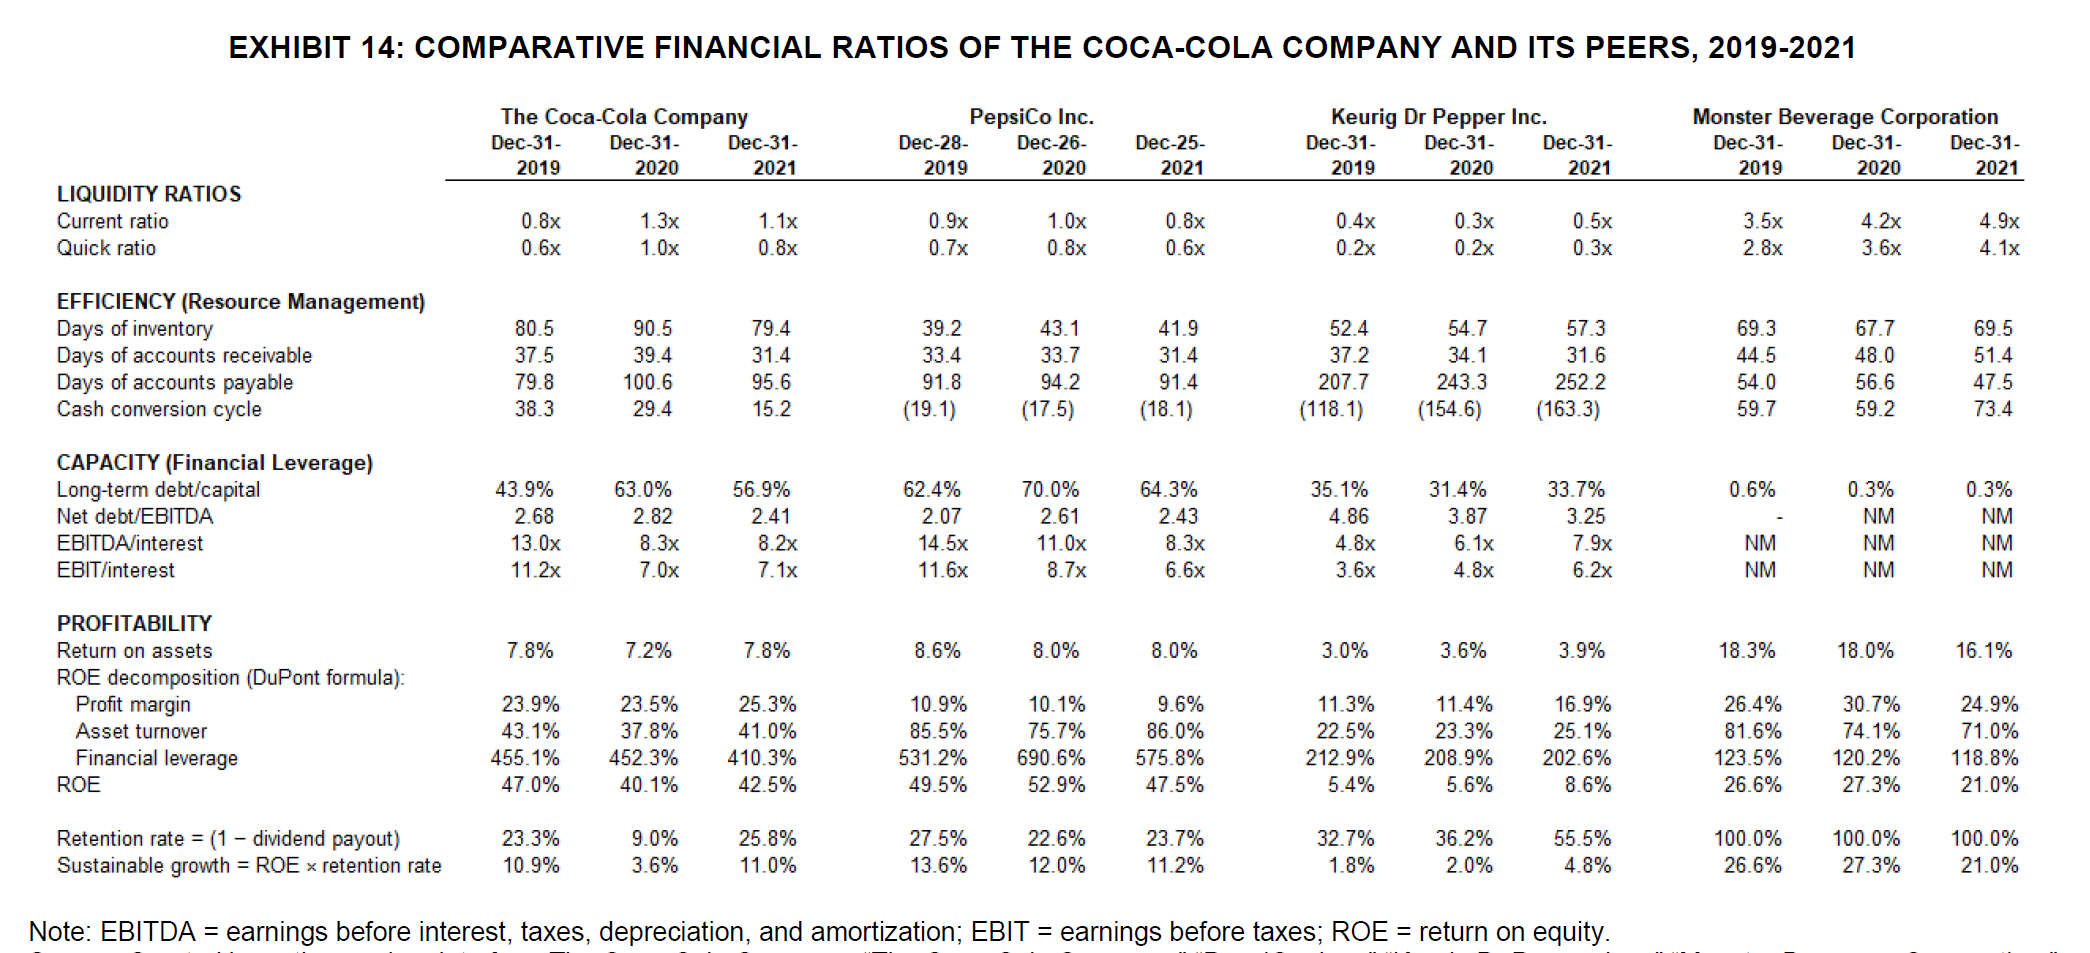
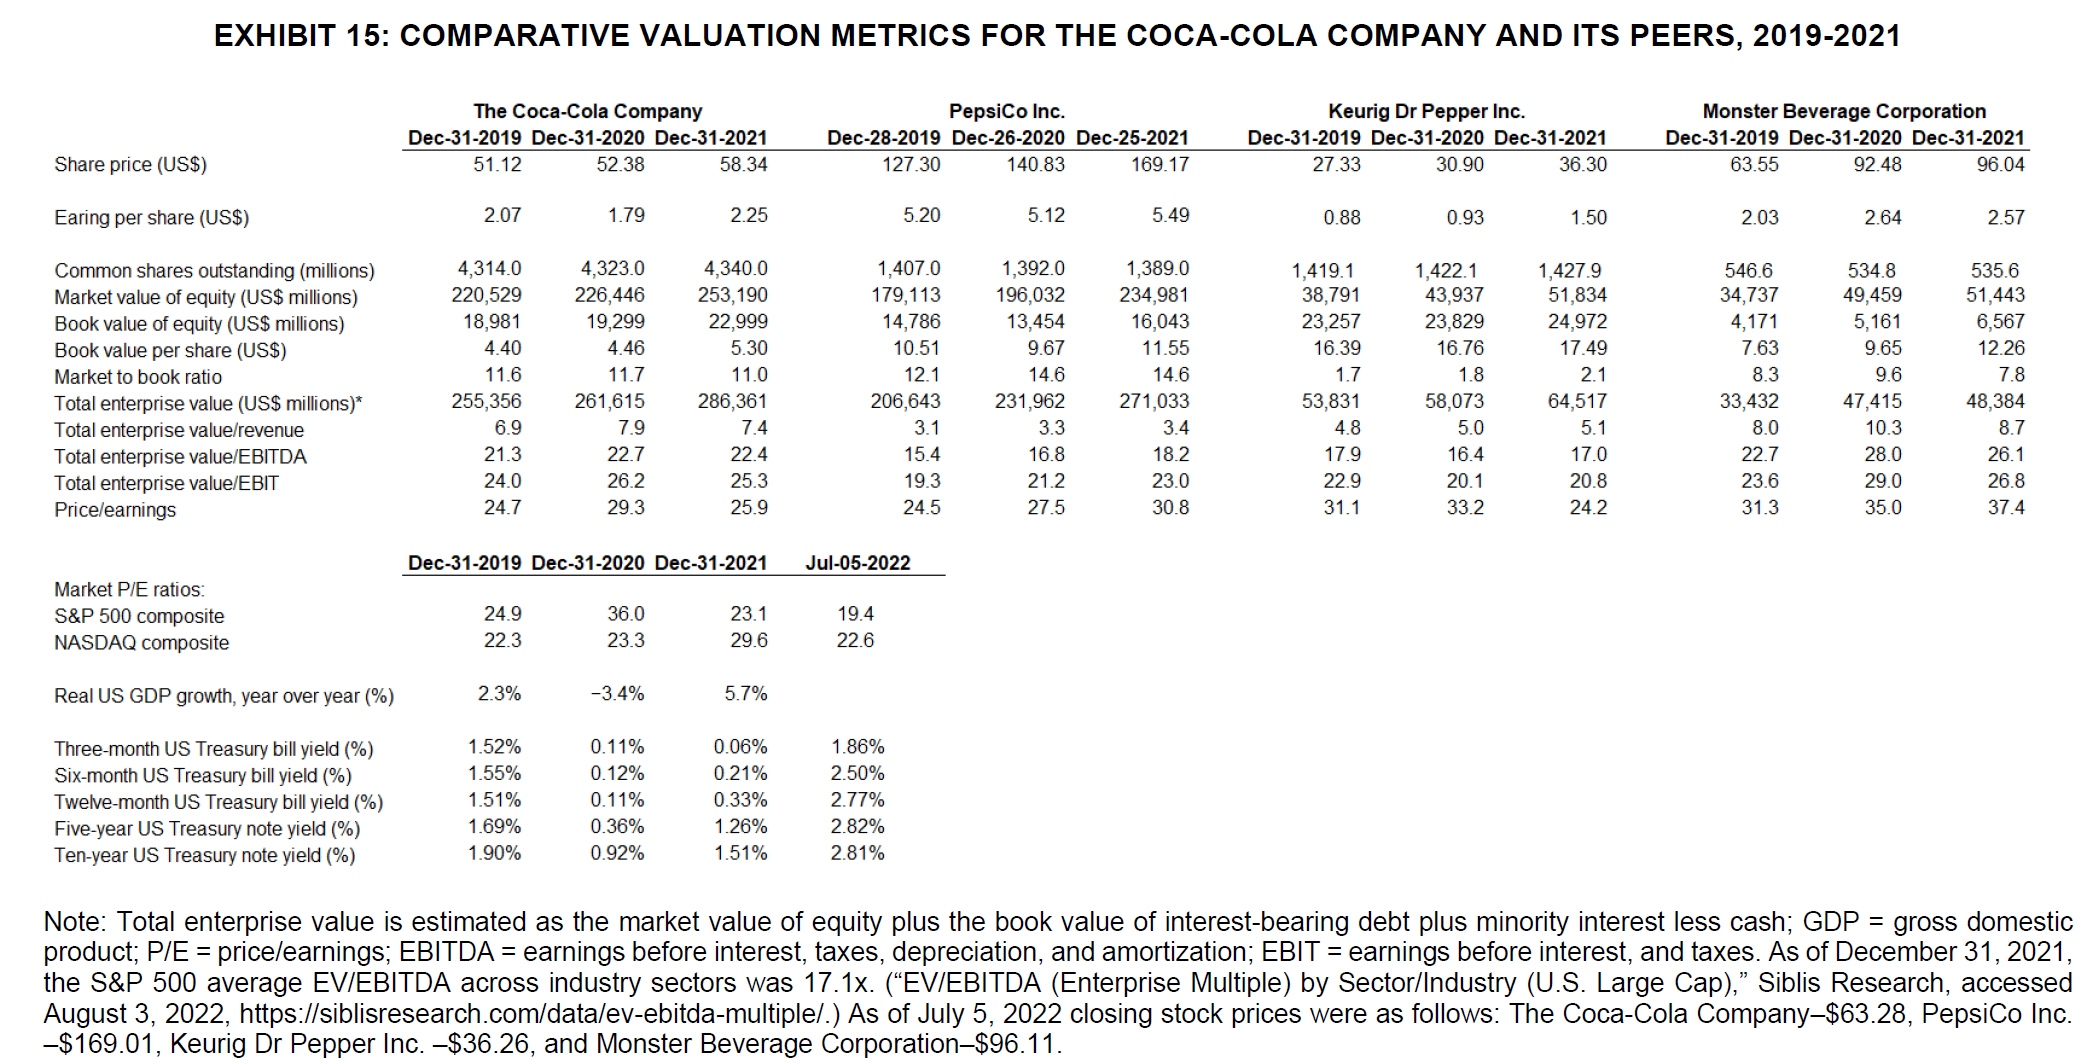
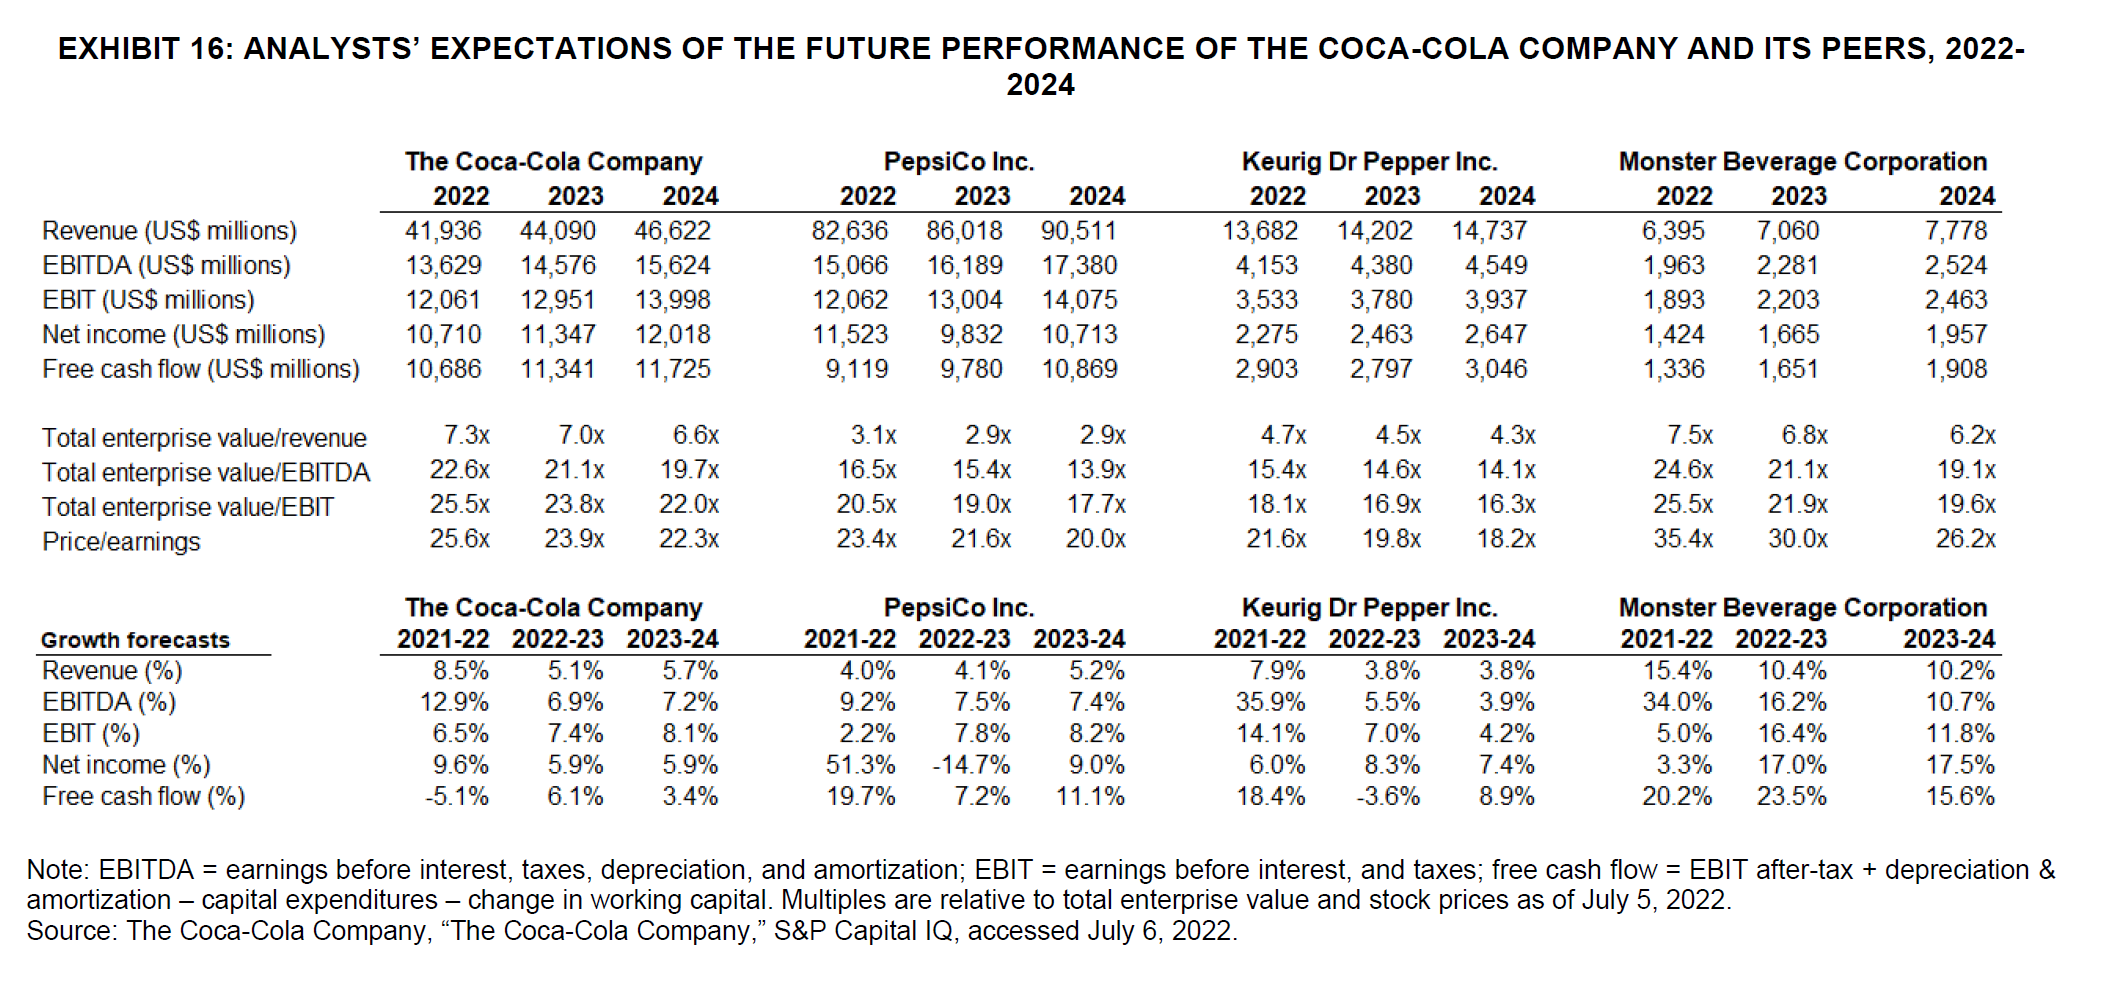
EXHIBIT 8: BALANCE SHEETS FOR THE COCA-COLA COMPANY AND ITS PEERS, 2019-2021 (US$ MILLIONS) The Coca-cola Company PepsiCo Inc. Keurig Dr Pepper Inc. Monster Beverage Corporation Dec-31-2019 Dec-31-2020 Dec-31-2021 Dec-28-2019 Dec-26-2020 Dec-25-2021 Dec-31-2019 Dec-31-2020 Dec-31-2021 Dec-31-2019 Dec-31-2020 Dec-31-2021 ASSETS Cash and short-term investments 11, 185.0 10,914.0 12,626.0 5,738.0 9,551.0 5,988.0 76.0 240.0 569.0 1,331.0 2,061.8 3,076.2 Accounts receivable 3,971.0 3,144.0 3,512.0 6,342.0 6,691.0 7,025.0 1,115.0 1,048.0 1,148.0 540.0 665.9 896.0 Other receivables 1,480.0 1,713.0 1,655.0 69.0 96.0 126.0 Inventory 3,379.0 3,266.0 3,414.0 3,338.0 4, 172.0 4,347.0 703.0 817.0 966.0 360.7 333.1 593.4 Prepaid ex 1,819.0 1,764.0 1,975.0 692.0 826.0 927.0 17.0 15.0 12.0 54.9 55.4 82.7 Other current assets 57.0 152.0 1,018.0 55.0 48.0 1,841.0 293.0 172.0 236.0 29.7 24.8 33.9 Total current assets 20,411.0 19,240.0 22,545.0 17,645.0 23,001.0 21,783.0 2,273.0 2,388.0 3,057.0 2,316.3 3,141.0 4,682.1 Gross property, plant & equipment 20,293.0 21,248.0 20,280.0 44,963.0 48,010.0 48,848.0 3,254.0 3,877.0 4,516.0 537.4 542.2 561.7 Accumulated depreciation (8,083.0) (8,923.0) (8,942.0) (24,110.0) 24,971.0) (24,421.0) (729.0) (1,020.0 (1,349.0) (207.4) 204.8) (224.8) Net property, plant & equipment 12,210.0 12,325.0 11,338.0 20,853.0 23,039.0 24,427.0 2,525.0 2,857.0 3,167.0 330.0 337.4 336.9 Long-term investments 21,730.0 22,311.0 20,540.0 2,683.0 2,792.0 2,627.0 170.0 89.0 31.0 12.9 44.3 100.8 Goodwill 16,764.0 17,506.0 19,363.0 15,501.0 18,757.0 18,381.0 20,172.0 20, 184.0 20,182.0 1,331.6 1,331.6 1,331.6 Other intangibles 10,002.0 11,044.0 15,250.0 16,043.0 19,315.0 18,665.0 24, 117.0 23,968.0 23,856.0 1,052.1 1,059.0 1,072.4 Deferred tax assets & charges, long-term 2,412.0 2,460.0 2, 129.0 4,506.0 4,502.0 4.429.0 290 45.0 42.0 84.8 241.7 225.2 Other long-term assets 2,852.0 2,410.0 3,189.0 1,316.0 1,512.0 2,065.0 232.0 248.0 263.0 22.6 47.7 55.7 Total assets 86,381.0 87.296.0 94.354.0 78.547.0 92.918.0 92.377.0 49.518.0 49.779.0 50.598.0 5,150.4 6,202.7 7.804.8 LIABILITIES Accounts payable 3,804.0 3,517.0 4,602.0 8,013.0 8,853.0 9,834.0 3,176.0 3,740.0 4,316.0 274.0 296.8 404.3 Accrued expenses 6,005.0 6,079.0 8,534.0 4,600.0 4,994.0 5,411.0 939.0 1,040.0 1,110.0 322.8 377.7 482.0 Short-term borrowings 10,994.0 2,183.0 3,307.0 72.0 422.0 436.0 1,246.0 149.0 Current portion of long-term debt 4,253.0 490.0 1,338.0 2,848.0 3,358.0 3,872.0 347.0 2,347.0 163.0 Current portion of leases 281.0 322.0 310.0 442.0 460.0 446.0 110.0 116.0 155.0 4.3 4.0 5.0 Other current liabilities 1,636.0 2,010.0 1,859.0 4,486.0 5,285.0 6,221.0 656.0 451.0 592.0 60.0 71.5 73.9 Total current liabilities 26,973.0 14,601.0 19,950.0 20,461.0 23,372.0 26,220.0 6,474.0 7,694.0 6,485.0 561.1 750.0 965.1 Long-term debt 27,537.0 40,125.0 38, 130.0 29, 148.0 40,370.0 36,026.0 12,827.0 11, 150.0 11,711.0 Long-term leases 1, 111.0 1,300.0 1, 161.0 1,118.0 1,233.0 1,598.0 696.0 878.0 1,229.0 25.7 17.4 17.4 Pension and other post-retirement benefits 2,000.0 2, 164.0 1,409.0 2,367.0 2,908.0 1,668.0 29.0 38.0 40.0 Deferred tax liability, non-current 2,284.0 1,833.0 2,821.0 4,091.0 4,284.0 4,826.0 6,030.0 5,993.0 5,986.0 Other non-current liabilities 5,378.0 6,989.0 6,023.0 6,494.0 7,199.0 5,888.0 205.0 196.0 175.0 292.3 274.5 255.3 Total liabilities 65,283.0 66,012.0 69,494.0 63,679.0 79,366.0 76,226.0 26,261.0 25,949.0 25,626.0 979.1 1,041.9 1,237.8 Total common equity 18,981.0 19,299.0 22,999.0 14,786.0 13,454.0 16,043.0 23,257.0 23,829.0 24,972.0 4,171.3 5,160.9 6,567.0 Minority interest 2,117.0 1,985.0 1,861.0 82.0 98.0 108.0 1.0 Total equity 21.098.0 21.284.0 24.860.0 14.868.0 13,552.0 16.151.0 23.257.0 23,830.0 24.972.0 4.171.3 5,160.9 6.567.0 Total liabilities and equity 86,381.0 87.296.0 94,354.0 78.547.0 92.918.0 92,377.0 49.518.0 49.779.0 50,598.0 5.150.4 6,202.7 7.804.8 Source: Created by authors using data from The Coca-cola Company, "The Coca-cola Company," "PepsiCo, Inc.," "Keurig Dr Pepper Inc.," "Monster Beverage Corporation," S&P Capital IQ, accessed July 6, 2022.EXHIBIT 9: BALANCE SHEETS FOR THE COCA-COLA COMPANY AND ITS PEERS, 2019-2021 (% OF ASSETS) The Coca-cola Company PepsiCo Inc. Keurig Dr Pepper Inc. Monster Beverage Corporation Dec-31-2019 Dec-31-2020 Dec-31-2021 Dec-28-2019 Dec-26-2020 Dec-25-2021 Dec-31-2019 Dec-31-2020 Dec-31-2021 Dec-31-2019 Dec-31-2020 Dec-31-2021 ASSETS Cash and short-term investments 12.9% 12.5% 13.4% 7.3% 10.3% 6.5% 0.2% 0.5% 1.1% 25.8% 33.2% 39.4% Accounts receivable 4.6% 3.6% 3.7% 8.1% 7.2% 7.6% 2.3% 2.1% 2.3% 10.5% 10.7% 11.5% Other receivables 1.9% 1.8% 1.8% 0.1% 0.2% 0.2% Inventory 3.9% 3.7% 3.6% 4.2% 4.5% 4.7% 1.4% 1.6% 1.9% 7.0% 5.4% 7.6% Prepaid expenses 2.1% 2.0% 2.1% 0.9% 0.9% 1.0% 0.0% 0.0% 0.0% 1.1% 0.9% 1.1% Other current assets 0.1% 0.2% 1.1% 0.1% 0.1% 2.0% 0.6% 0.3% 0.5% 0.6% 0.4% 0.4% Total current assets 23.6% 22.0% 23.9% 22.5% 24.8% 23.6% 4.6% 4.8% 6.0% 45.0% 50.6% 60.0% Gross property, plant & equipment 23.5% 24.3% 21.5% 57.2% 51.7% 52.9% 6.6% 7.8% 8.9% 10.4% 8.7% 7.2% Accumulated depreciation (9.4%) (10.2%) (9.5%) (30.7%) (26.9%) (26.4%) (1.5%) (2.0%) (2.7%) (4.0%) (3.3%) (2.9%) Net property, plant & equipment 14.1% 14.1% 12.0% 26.5% 24.8% 26.4% 5.1% 5.7% 6.3% 6.4% 5.4% 4.3% Long-term investments 25.2% 25.6% 21.8% 3.4% 3.0% 2.8% 0.3% 0.2% 0.1% 0.3% 0.7% 1.3% Goodwill 19.4% 20.1% 20.5% 19.7% 20.2% 19.9% 40.7% 40.5% 39.9% 25.9% 21.5% 17.1% Other intangibles 11.6% 12.7% 16.2% 20.4% 20.8% 20.2% 48.7% 48.1% 47.1% 20.4% 17.1% 13.7% Deferred tax assets & charges, long-term 2.8% 2.8% 2.3% 5.7% 4.8% 4.8% 0.1% 0.1% 0.1% 1.6% 3.9% 2.9% Other long-term assets 3.3% 2.8% 3.4% 1.7% 1.6% 2.2% 0.5% 0.5% 0.5% 0.4% 0.8% 0.7% Total assets 100.0% 100.0% 100.0% 100.0% 100.0% 100.0% 100.0% 100.0% 100.0% 100.0% 100.0% 100.0% LIABILITIES Accounts payable 4.4% 4.0% 4.9% 10.2% 9.5% 10.6% 6.4% 7.5% 8.5% 5.3% 4.8% 5.2% 7.0% 7.0% 9.0% 5.9% 5.4% 5.9% 1.9% 2.1% 2.2% 6.3% 6.1% 6.2% Accrued expenses Short-term borrowings 12.7% 2.5% 3.5% 0.1% 0.5% 0.5% 2.5% 0.3% Current portion of long-term debt 4.9% 0.6% 1.4% 3.6% 3.6% 4.2% 0.7% 4.7% 0.3% Current portion of leases 0.3% 0.4% 0.3% 0.6% 0.5% 0.5% 0.2% 0.2% 0.3% 0.1% 0.1% 0.1% Other current liabilities 1.9% 2.3% 2.0% 6.7% 5.7% 6.7% 1.3% 0.9% 1.2% 1.2% 1.2% 0.9% Total current liabilities 31.2% 16.7% 21.1% 26.0% 25.2% 28.4% 13.1% 15.5% 12.8% 12.8% 12.1% 12.4% Long-term debt 31.9% 46.0% 40.4% 37.1% 43.4% 39.0% 25.9% 22.4% 23.1% 1.3% 1.5% 1.2% 1.4% 1.3% 1.7% 1.4% 1.8% 2.4% 0.5% 0.3% 0.2% Long-term leases Pension and other post-retirement benefits 2.3% 2.5% 1.5% 3.0% 3.1% 1.8% 0.1% 0.1% 0.1% Deferred tax liability, non-current 2.6% 2.1% 3.0% 5.2% 4.6% 5.2% 12.2% 12.0% 11.8% Other non-current liabilities 6.2% 6.9% 6.4% 8.3% 7.7% 6.4% 0.4% 0.4% 0.3% 5.7% 4.4% 3.3% Total liabilities 75.6% 75.6% 73.7% 81.1% 85.4% 82.5% 53.0% 52.1% 50.6% 19.0% 16.8% 15.9% Total common equity 22.0% 22.1% 24.4% 18.8% 14.5% 17.4% 47.0% 47.9% 49.4% 81.0% 83.2% 84.1% Minority interest 2.5% 2.3% 2.0% 0.1% 0.1% 0.1% 0.0% 0.0% 0.0% 0.0% 0.0% 0.0% Total equity 24.4% 24.4% 26.3% 18.9% 14.6% 17.5% 47.0% 47.9% 49.4% 81.0% 83.2% 84.1% 100.0% 100.0% 100.0% 100.0% 100.0% 100.0% 100.0% 100.0% 100.0% Total liabilities and equity 100.0% 100.0% 100.0%EXHIBIT 10: INCOME STATEMENTS FOR THE COCA-COLA COMPANY AND ITS PEERS, 2019-2021 (US$ MILLIONS, EXCEPT WHERE INDICATED) The Coca-cola Company PepsiCo Inc. Keurig Dr Pepper Inc. Monster Beverage Corporation For the Fiscal Period Ending Dec-31- Dec-31- Dec-31- Dec-28- Dec-26- Dec-25- Dec-31- Dec-31- Dec-31- Dec-31- Dec-31- Dec-31- 2019 2020 2021 2019 2020 2021 2019 2020 2021 2019 2020 2021 Total revenue 37,266.0 33,014.0 38,655.0 67,161.0 70,372.0 79,474.0 11, 120.0 11,618.0 12,683.0 4,200.8 4,598.6 5,541.4 Cost of goods sold 14,619.0 13,433.0 15,357.0 29,983.0 31,735.0 37,045.0 4,778.0 5,088.0 5,680.0 1,682.2 1,874.8 2,432.8 Gross profit 22,647.0 19,581.0 23,298.0 37,178.0 38,637.0 42,429.0 6,342.0 6,530.0 7,003.0 2,518.6 2,723.9 3,108.5 Selling, general & administrative expenses 12,011.0 9,579.0 11,984.0 25,749.0 26,988.0 29,875.0 3,736.0 3,398.0 3,724.0 1, 104.3 1,090.5 1,305.7 Other operating expense/(income) 11.0 12.0 (7.0) 710.0 713.0 756.0 257.0 241.0 183.0 Other operating expenses, total 12,022.0 9,591.0 11,977.0 26,459.0 27,701.0 30,631.0 3,993.0 3,639.0 3,907.0 1,104.3 1,090.5 1,305.7 Operating income (EBIT) 10,625.0 9.990.0 11,321.0 10,719.0 10.936.0 11,798.0 2,349.0 2,891.0 3,096.0 1,414.2 1,633.4 1,802.8 Net interest expense (383.0) (995.0) (1,248.0) 928.0) (1,257.0) (1,799.0) (654.0) (604.0) (500.0) (0.1) 8.1 4.2 Income/(loss) from affiliates 1,049.0 978.0 1,438.0 (51.0) (20.0) (5.0) Currency exchange gains (loss) (64.0) (61.0) 4.0 (18.0) (6.0) (4.1) (11.2) 0.3 Other non-operating income (expenses) (27.0) (40.0 102.0 9.0 20.0 73.0 8.0 4.0 17.2 (3.9 (0.5) EBT excluding unusual items 11,264.0 9,869.0 11,552.0 9,791.0 9,688.0 10,023.0 1,699.0 2,269.0 2,595.0 1,427.2 1,626.3 1,806.7 Restructuring charges (264.0) (760.0) (648.0) (370.0) (289.0) (247.0) Merger & related restructuring charges (46.0 (119.0) (55.0) (255.0) 4.0 (199.0) (204.0) Impairment of goodwill (14.0) (7.0) Gain (loss) on sale of investments (478.0) 769.0 2, 110.0 (102.0) 507.0 Gain (loss) on sale of assets 829.0 18.0 30.0 42.0 70.0 Other unusual items (519.0) (115.0) (463.0) (54.0) (75.0) 23.0 (35.0 (257.0) (170.0) (11.3) (0.2) (5.3) EBT including unusual items 10,786.0 9,749.0 12,425.0 9,312.0 9,069.0 9,821.0 1,694.0 1,753.0 2,798.0 1,415.9 1,626.1 1,801.4 Income tax expense 1,801.0 1,981.0 2,621.0 1,959.0 1,894.0 2, 142.0 440.0 428.0 653.0 308.1 216.6 423.9 Net income to company 8,985.0 7,768.0 9,804.0 7,353.0 7,175.0 7,679.0 1,254.0 1,325.0 2,145.0 1,107.8 1,409.6 1,377.5 Minority interest in earnings (65.0) (21.0) (33.0) (39.0) (55.0) (61.0) 1.0 Net income 8.920.0 7.747.0 9.771.0 Z.314.0 7.120.0 7.618.0 1.254.0 1,325.0 2.146.0 1.107.8 1,409.6 1.377.5 Shares outstanding (millions) 4,314.0 4,323.0 4,340.0 1,407.0 1,392.0 1,389.0 1,419.1 1,422.1 1,427.9 546.6 534.8 535.6 Diluted earnings per share (US$) $2.07 $1.79 $2.25 $5.20 $5.12 $5.49 $0.88 $0.93 $1.50 $2.03 $2.64 $2.57 Dividends per share (US$) $1.60 $1.64 $1.68 $3.79 $4.02 $4.25 $0.6 $0.6 $0.71 Dividend payout ratio (%) 76.7% 91.0% 74.2% 72.5% 77.4% 76.3% 67.3% 63.8% 44.5% Note: EBIT = earnings before interest and taxes; EBT = earnings before taxes.EXHIBIT 11: INCOME STATEMENTS FOR THE COCA-COLA COMPANY AND ITS PEERS, 2019-2021 (% OF REVENUE) The Coca-Cola Company PepsiCo Inc. Keurig Dr Pepper Inc. Monster Beverage Corporation For the Fiscal Period Ending Dec-31- Dec-31- Dec-31- Dec-28- Dec-26- Dec-25- Dec-31- Dec-31- Dec-31- Dec-31- Dec-31- Dec-31- 2019 2020 2021 2019 2020 2021 2019 2020 2021 2019 2020 2021 Total revenue 100.0% 100.0% 100.0% 100.0% 100.0% 100.0% 100.0% 100.0% 100.0% 100.0% 100.0% 100.0% Cost of goods sold 39.2% 40.7% 39.7% 44.6% 45.1% 46.6% 43.0% 43.8% 44.8% 40.0% 40.8% 43.9% Gross profit 60.8% 59.3% 60.3% 55.4% 54.9% 53.4% 57.0% 56.2% 55.2% 60.0% 59.2% 56.1% Selling, general & administrative expens 32.2% 29.0% 31.0% 38.3% 38.4% 37.6% 33.6% 29.2% 29.4% 26.3% 23.7% 23.6% Other operating expense/(income) 0.0% 0.0% (0.0%) 1.1% 1.0% 1.0% 2.3% 2.1% 1.4% Other operating expenses, total 32.3% 29.1% 31.0% 39.4% 39.4% 38.5% 35.9% 31.3% 30.8% 26.3% 23.7% 23.6% Operating income (EBIT) 28.5% 30.3% 29.3% 16.0% 15.5% 14.8% 21.1% 24.9% 24.4% 33.7% 35.5% 32.5% Net interest expense (1.0%) (3.0%) (3.2%) (1.4%) (1.8%) (2.3%) (5.9%) (5.2%) (3.9%) (0.0%) 0.2% 0.1% Income/(loss) from affiliates 2.8% 3.0% 3.7% (0.5%) (0.2%) (0.0%) 0.0% 0.0% 0.0% Currency exchange gains (loss) (0.2%) (0.2%) 0.0% (0.2%) (0.1%) (0.1%) (0.2%) 0.0% Other non-operating income (expenses) (0.07%) (0.12%) 0.26% 0.01% 0.03% 0.66% 0.07% 0.03% 0.41% (0.08%) (0.01%) EBT excluding unusual items 30.2% 29.9% 29.9% 14.6% 13.8% 12.6% 15.3% 19.5% 20.5% 34.0% 35.4% 32.6% Restructuring charges -0.7% -2.3% -1.7% -0.6% -0.4% -0.3% Merger & related restructuring charges -0.1% -0.3% -0.1% -0.4% 0.0% -1.7% -1.6% Impairment of goodwill (0.0%) (0.0%) Gain (loss) on sale of investments (1.3%) 2.3% 5.5% (0.9%) 4.0% Gain (loss) on sale of assets 2.2% 0.0% 0.3% 0.4% 0.6% Other unusual items (1.4% (0.3%) (1.2%) (0.1%) (0.1% 0.0% (0.3%) (2.2%) (1.3%) (0.3%) (0.0%) (0.1%) EBT including unusual items 28.9% 29.5% 32.1% 13.9% 12.9% 12.4% 15.2% 15.1% 22.1% 33.7% 35.4% 32.5% Income tax expense 4.8% 6.0% 6.8% 2.9% 2.7% 2.7% 4.0% 3.7% 5.1% 7.3% 4.7% 7.7% Net income to company 24.1% 23.5% 25.4% 10.9% 10.2% 9.7% 11.3% 11.4% 16.9% 26.4% 30.7% 24.9% Minority interest in earnings (0.2%) (0.1%) (0.1%) 0.1%) (0.1%) (0.1%) 0.0% Net income 23.9% 23.5% 25.3% 10.9% 10.1% 9.6% 11.3% 11.4% 16.9% 26.4% 30.7% 24.9%EXHIBIT 12: CASH FLOW STATEMENTS FOR THE COCA-COLA COMPANY AND ITS PEERS, 2019-2021 (US$ MILLIONS) The Coca-Cola Company Pepsico Inc. Keurig Dr Pepper Inc. Monster Beverage Corporation Dec-31-2019 Dec-31-2020 Dec-31-2021 Dec-28-2019 Dec-26-2020 Dec-25-2021 Dec-31-2019 Dec-31-2020 Dec-31-2021 Dec-31-2019 Dec-31-2020 Dec-31-2021 Net income 8,920.0 7,747.0 9,771.0 7,314.0 7, 120.0 7,618.0 1,254.0 1,325.0 2,146.0 1, 107.8 1,409.6 1,377.5 Depreciation & amortization 1,365.0 1,536.0 1,452.0 2,678.0 2,874.0 3,080.0 658.0 653.0 708.0 60.7 57.0 50.2 Change in working capital 977.0 121.0 2,483.0 (105.0) (170.0) 529.0 552.0 512.0 477.0 (81.3) 27.5 (186.2) Change in other net operating assets (791.0) 440.0 (1,081.0) (238.0) 789.0 389.0 10.0 (34.0) (457.0) 26.4 (130.0) (85.7) Cash from operations 10,471.0 9,844.0 12,625.0 9,649.0 10,613.0 11,616.0 2,474.0 2,456.0 2,874.0 1,113.7 1,364.1 1,155.7 Capital expenditure (2,054.0) (1,177.0) (1,367.0) (4,232.0) (4,240.0) (4,625.0) (330.0) (461.0) (423.0) (101.7) (48.7) (43.9) Sale of property, plant & equipment 978.0 189.0 108.0 170.0 55.0 166.0 247.0 203.0 122.0 1.2 1.0 1.3 Cash acquisitions (5,542.0) (1,052.0) (4,766.0) (2,717.0) (6,372.0) (61.0) (8.0) Divestitures 429.0 189.0 2, 180.0 253.0 6.0 169 0 Investment in marketable & equity securities 2,269.0 252.0 1,029.0 97.0 (1, 108.0) 1,077.0 (16.0) (5.0) 578.0 (216.3) (379.8) (924.5) Other investing activities (56.0) 122.0 51.0 (8.0) 40.0 5.0 (43.0) (53.0) (67.0) (10.0) (45.0) (25.0) Cash from investing (3,976.0) (1,477.0) (2,765.0) (6,437.0) (11,619.0) (3,269.0) (150.0) (316.0) 210.0 (326.8) (472.5) (992.1) Total debt issued 23,009.0 26,934.0 13,094.0 4,627.0 17,886.0 4,564.0 18, 197.0 10,638.0 7,556.0 2.9 Total debt repaid (24,850.0) (28,796.0) (12,866.0) (3,975.0) (5,493.0) (3,852.0) (19,521.0) (11,641.0) (9,331.0) (13.6) (3.1) Issuance of common stock 1,012.0 647.0 702.0 329.0 179.0 185.0 140.0 92.4 72.9 45.7 Repurchase of common stock (1, 103.0) (118.0) (111.0) (3, 114.0) (2,096.0) (198.0) (125.0) (707.3) (595.9) (13.8) Total dividends paid (6,845.0) (7,047.0) (7,252.0) (5,304.0) (5,509.0) (5,815.0) (844.0) (846.0) (955.0) Other financing activities (227.0) 310.0 (353.0) (1,052.0) (1,148.0) (5,664.0) (196.0) (141.0) (47.0) Cash from financing (9,004.0) (8,070.0) (6,786.0) (8,489.0) 3,819.0 (10,780.0) (2,364.0) (1,990.0) (2,762.0) (628.5) (526.1) 34.9 Foreign exchange rate adjusted (72.0) 76.0 (159.0) 78.0 (129.0) (114.0) 12.0 (6.0) (9.0) 1.9 16.8 (52.5) Net change in cash (2,581.0) 373.0 2,915.0 (5,199.0) 2,684.0 (2,547.0) (28.0) 144.0 313.0 160.3 382.4 146.0LIQUIDITY RATIOS Current ratio Quick ratio EFFICIENCY (Resource Management) Days of inventory Days of accounts receivable Days of accounts payable Cash conversion cycle CAPACITY (Financial Leverage) Long-term debt/capital Net debt/EBITDA EBITDA/interest EBIT/interest PROFITABILITY Return on assets ROE decomposition (DuPont formula): Profit margin Asset turnover Financial leverage Return on equity EXHIBIT 13: RELATED FINANCIAL RATIOS Total current assets + total current liabilities (Cash + marketable securities + account receivable) + total current liabilities Inventory + (cost of goods sold + 365) Accounts receivable + (revenue + 365) Accounts payable / (cost of goods sold* + 365) *I'fpurchases are not available Days of inventory + days of accounts receivable - days of accounts payable Interest-bearing debt + (common equity + preferreds + interest-bearing debt) (Interest-bearing debt - cash) + operating income before depreciation & amortization Operating income before depreciation & amortization + interest expense Operating income + interest expense Net income + total assets Net income + revenue Revenue + total assets Total assets + total equity Profit margin x asset turnover X financial leverage Note: EBITDA = earnings before interest, taxes, depreciation, and amortization; EBIT = earnings before interest and taxes. Source: Created by the case author. EXHIBIT 14: COMPARATIVE FINANCIAL RATIOS OF THE COCA-COLA COMPANY AND ITS PEERS, 2019-2021 The Coca-Cola Company PepsiCo Inc. Keurig Dr Pepper Inc. Monster Beverage Corporation Dec-31- Dec-31- Dec-31- Dec-28- Dec-26- Dec-25- Dec-31- Dec-31- Dec-31- Dec-31- Dec-31- Dec-31- 2019 2020 2021 2019 2020 2021 2019 2020 2021 2019 2020 2021 LIQUIDITY RATIOS Current ratio 0.8x 1.3x 1.1x 0.9x 1.0x 0.8x 0.4x 0.3x 0.5x 3.5x 4.2x 4.9x Quick ratio 0.6x 1.0x 0.8x 0.7x 0.8x 0.6x 0.2x 0.2x 0.3x 2.8x 3.6x 4.1x EFFICIENCY (Resource Management) Days of inventory 80.5 90.5 79.4 39.2 43.1 41.9 52.4 54.7 57.3 69.3 67.7 69.5 Days of accounts receivable 37.5 39.4 31.4 33.4 33.7 31.4 37.2 34.1 31.6 44.5 48.0 51.4 Days of accounts payable 79.8 100.6 95.6 91.8 94.2 91.4 207.7 243.3 252.2 54.0 56.6 47.5 Cash conversion cycle 38.3 29.4 15.2 (19.1) (17.5) (18.1) (118.1) (154.6) (163.3) 59.7 59.2 73.4 CAPACITY (Financial Leverage) Long-term debt/capital 43.9% 63.0% 56.9% 62.4% 70.0% 64.3% 35.1% 31.4% 33.7% 0.6% 0.3% 0.3% Net debt/EBITDA 2.68 2.82 2.41 2.07 2.61 2.43 4.86 3.87 3.25 NM NM EBITDA/interest 13.0x 8.3x 8.2x 14.5x 11.0x 8.3x 4.8x 6.1x 7.9x NM NM NM EBIT/interest 11.2x 7.0x 7.1x 11.6x 8.7x 6.6x 3.6x 4.8x 6.2x NM NM NM PROFITABILITY Return on assets 7.8% 7.2% 7.8% 8.6% 8.0% 8.0% 3.0% 3.6% 3.9% 18.3% 18.0% 16.1% ROE decomposition (DuPont formula): Profit margin 23.9% 23.5% 25.3% 10.9% 10.1% 9.6% 11.3% 11.4% 16.9% 26.4% 30.7% 24.9% Asset turnover 43.1% 37.8% 41.0% 85.5% 75.7% 86.0% 22.5% 23.3% 25.1% 81.6% 74.1% 71.0% Financial leverage 455.1% 452.3% 410.3% 531.2% 690.6% 575.8% 212.9% 208.9% 202.6% 123.5% 120.2% 118.8% ROE 47.0% 40.1% 42.5% 49.5% 52.9% 47.5% 5.4% 5.6% 8.6% 26.6% 27.3% 21.0% Retention rate = (1 - dividend payout) 23.3% 9.0% 25.8% 27.5% 22.6% 23.7% 32.7% 36.2% 55.5% 100.0% 100.0% 100.0% Sustainable growth = ROE x retention rate 10.9% 3.6% 11.0% 13.6% 12.0% 11.2% 1.8% 2.0% 4.8% 26.6% 27.3% 21.0% Note: EBITDA = earnings before interest, taxes, depreciation, and amortization; EBIT = earnings before taxes; ROE = return on equity.EXHIBIT 15: COMPARATIVE VALUATION METRICS FOR THE COCA-COLA COMPANY AND ITS PEERS, 2019-2021 The Coca-cola Company PepsiCo Inc. Keurig Dr Pepper Inc. Monster Beverage Corporation Dec-31-2019 Dec-31-2020 Dec-31-2021 Dec-28-2019 Dec-26-2020 Dec-25-2021 Dec-31-2019 Dec-31-2020 Dec-31-2021 Dec-31-2019 Dec-31-2020 Dec-31-2021 Share price (US$) 51.12 52.38 58.34 127.30 140.83 169.17 27.33 30.90 36.30 63.55 92.48 96.04 Earing per share (US$) 2.07 1.79 2.25 5.20 5.12 5.49 0.88 0.93 1.50 2.03 2.64 2.57 Common shares outstanding (millions) 4,314.0 4,323.0 4,340.0 1,407.0 1,392.0 1,389.0 1,419.1 1,422.1 1,427.9 546.6 534.8 535.6 Market value of equity (US$ millions) 220,529 226,446 253, 190 179, 113 196,032 234,981 38,791 43,937 51,834 34,737 49,459 51,443 Book value of equity (US$ millions) 18,981 19,299 22,999 14,786 13,454 16,043 23,257 23,829 24,972 4,171 5,161 6,567 Book value per share (US$) 4.40 4.46 5.30 10.51 9.67 11.55 16.39 16.76 17.49 7.63 9.65 12.26 Market to book ratio 11.6 11.7 11.0 12.1 14.6 14.6 1.7 1.8 2.1 8.3 9.6 7.8 Total enterprise value (US$ millions)* 255,356 261,615 286,361 206,643 231,962 271,033 53,831 58,073 64,517 33,432 47,415 48,384 Total enterprise value/revenue 6.9 7.9 7.4 3.1 3.3 3.4 4.8 5.0 5.1 8.0 10.3 8.7 Total enterprise value/EBITDA 21.3 22.7 22.4 15.4 16.8 18.2 17.9 16.4 17.0 22.7 28.0 26.1 Total enterprise value/EBIT 24.0 26.2 25.3 19.3 21.2 23.0 22.9 20.1 20.8 23.6 29.0 26.8 Price/earnings 24.7 29.3 25.9 24.5 27.5 30.8 31.1 33.2 24.2 31.3 35.0 37.4 Dec-31-2019 Dec-31-2020 Dec-31-2021 Jul-05-2022 Market P/E ratios: S&P 500 composite 24.9 36.0 23.1 19.4 NASDAQ composite 22.3 23.3 29.6 22.6 Real US GDP growth, year over year (%) 2.3% -3.4% 5.7% Three-month US Treasury bill yield (%) 1.52% 0.11% 0.06% 1.86% Six-month US Treasury bill yield (%) 1.55% 0.12% 0.21% 2.50% Twelve-month US Treasury bill yield (%) 1.51% 0.11% 0.33% 2.77% Five-year US Treasury note yield (%) 1.69% 0.36% 1.26% 2.82% Ten-year US Treasury note yield (%) 1.90% 0.92% 1.51% 2.81% Note: Total enterprise value is estimated as the market value of equity plus the book value of interest-bearing debt plus minority interest less cash; GDP = gross domestic product; P/E = price/earnings; EBITDA = earnings before interest, taxes, depreciation, and amortization; EBIT = earnings before interest, and taxes. As of December 31, 2021, the S&P 500 average EV/EBITDA across industry sectors was 17.1x. ("EV/EBITDA (Enterprise Multiple) by Sector/Industry (U.S. Large Cap)," Siblis Research, accessed August 3, 2022, https://siblisresearch.com/data/ev-ebitda-multiple/.) As of July 5, 2022 closing stock prices were as follows: The Coca-cola Company-$63.28, PepsiCo Inc. -$169.01, Keurig Dr Pepper Inc. -$36.26, and Monster Beverage Corporation-$96.11.EXHIBIT 16: ANALYSTS' EXPECTATIONS OF THE FUTURE PERFORMANCE OF THE COCA-COLA COMPANY AND ITS PEERS, 2022- 2024 The Coca-Cola Company PepsiCo Inc. Keurig Dr Pepper Inc. Monster Beverage Corporation 2022 2023 2024 2022 2023 2024 2022 2023 2024 2022 2023 2024 Revenue (US$ millions) 41,936 44,090 46,622 82,636 86,018 90,511 13,682 14,202 14,737 6,395 7,060 7,778 EBITDA (US$ millions) 13,629 14,576 15,624 15,066 16, 189 17,380 4,153 4,380 4,549 1,963 2,281 2,524 EBIT (US$ millions) 12,061 12,951 13,998 12,062 13,004 14,075 3,533 3,780 3,937 1,893 2,203 2,463 Net income (US$ millions) 10,710 11,347 12,018 11,523 9,832 10,713 2,275 2,463 2,647 1,424 1,665 1,957 Free cash flow (US$ millions) 10,686 11,341 11,725 9,119 9,780 10,869 2,903 2,797 3,046 1,336 1,651 1,908 Total enterprise value/revenue 7.3x 7.0x 6.6x 3.1x 2.9x 2.9x 4.7x 4.5x 4.3x 7.5x 6.8x 6.2x Total enterprise value/EBITDA 22.6x 21.1x 19.7x 16.5x 15.4x 13.9x 15.4x 14.6x 14.1x 24.6x 21.1x 19.1x Total enterprise value/EBIT 25.5x 23.8x 22.0x 20.5x 19.0x 17.7x 18.1x 16.9x 16.3x 25.5x 21.9x 19.6x Price/earnings 25.6x 23.9x 22.3x 23.4x 21.6x 20.0x 21.6x 19.8x 18.2x 35.4x 30.0x 26.2x The Coca-cola Company PepsiCo Inc. Keurig Dr Pepper Inc. Monster Beverage Corporation Growth forecasts 2021-22 2022-23 2023-24 2021-22 2022-23 2023-24 2021-22 2022-23 2023-24 2021-22 2022-23 2023-24 Revenue (%) 8.5% 5.1% 5.7% 4.0% 4.1% 5.2% 7.9% 3.8% 3.8% 15.4% 10.4% 10.2% EBITDA (%) 12.9% 6.9% 7.2% 9.2% 7.5% 7.4% 35.9% 5.5% 3.9% 34.0% 16.2% 10.7% EBIT (%) 6.5% 7.4% 8.1% 2.2% 7.8% 8.2% 14.1% 7.0% 4.2% 5.0% 16.4% 11.8% Net income (%) 9.6% 5.9% 5.9% 51.3% -14.7% 9.0% 6.0% 8.3% 7.4% 3.3% 17.0% 17.5% Free cash flow (%) -5.1% 6.1% 3.4% 19.7% 7.2% 11.1% 18.4% -3.6% 8.9% 20.2% 23.5% 15.6% Note: EBITDA = earnings before interest, taxes, depreciation, and amortization; EBIT = earnings before interest, and taxes; free cash flow = EBIT after-tax + depreciation & amortization - capital expenditures - change in working capital. Multiples are relative to total enterprise value and stock prices as of July 5, 2022. Source: The Coca-cola Company, "The Coca-cola Company," S&P Capital IQ, accessed July 6, 2022
Step by Step Solution
There are 3 Steps involved in it
1 Expert Approved Answer
Step: 1 Unlock
Question Has Been Solved by an Expert!
Get step-by-step solutions from verified subject matter experts
Step: 2 Unlock
Step: 3 Unlock
Students Have Also Explored These Related Finance Questions!