

Question: 1. What is the exit multiple terminal value on Dec 31,2028? a) 1,605,714 b) 1,853,611 c) 2,232,891 d) 2,151,659 2. What is Amazon's enterprise value
1. What is the exit multiple terminal value on Dec 31,2028?
a) 1,605,714
b) 1,853,611
c) 2,232,891
d) 2,151,659
2. What is Amazon's enterprise value on the valuation date using the exit multiple terminal value?
a) 1,029,071
b) 1,414,325
c) 1,378,837
d) 2,088,584
3. Calculate Amazon's target share price using the assumptions and exit multiple terminal value, then perform a sensitivity analysis. What will the share price be if the exit multiple is 16.0x and the discount rate is 10.5%?
a) 2,717
b) 2,502
c) 2,473
d) 2,686
Below Financial Statements needed:
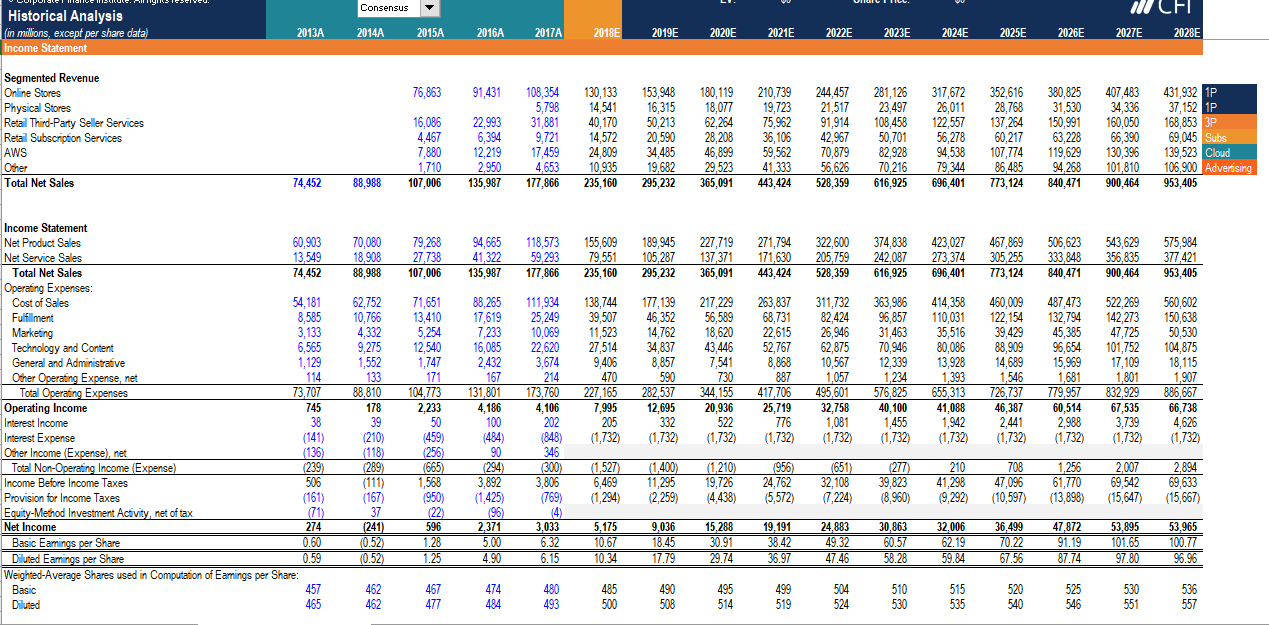
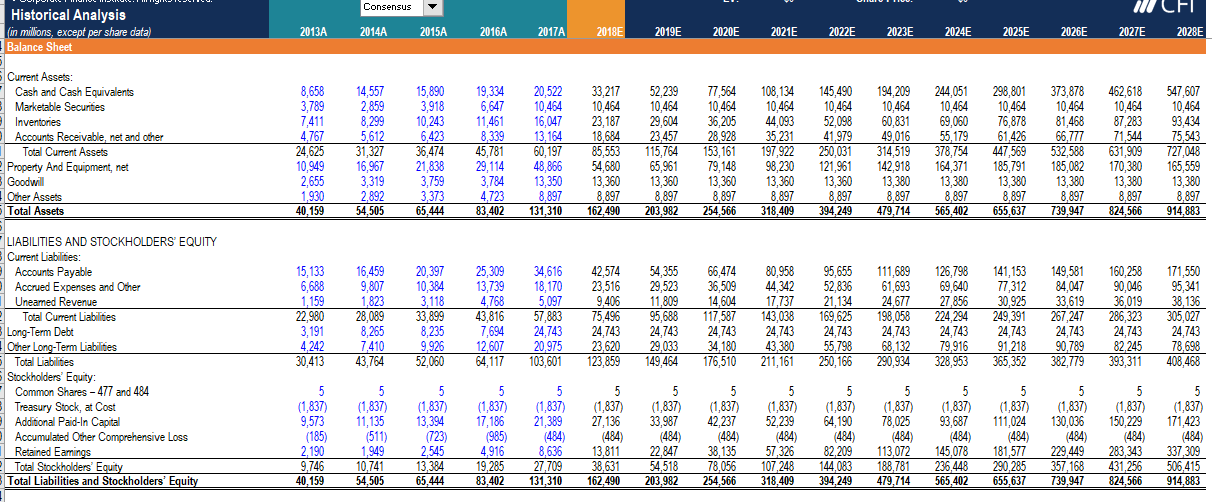
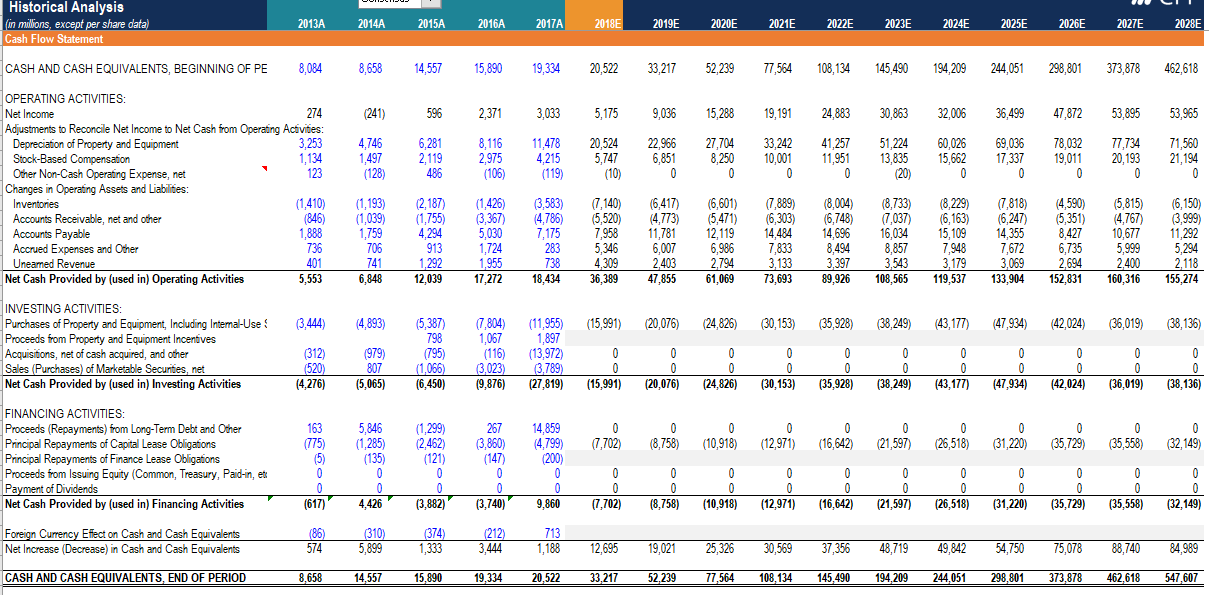
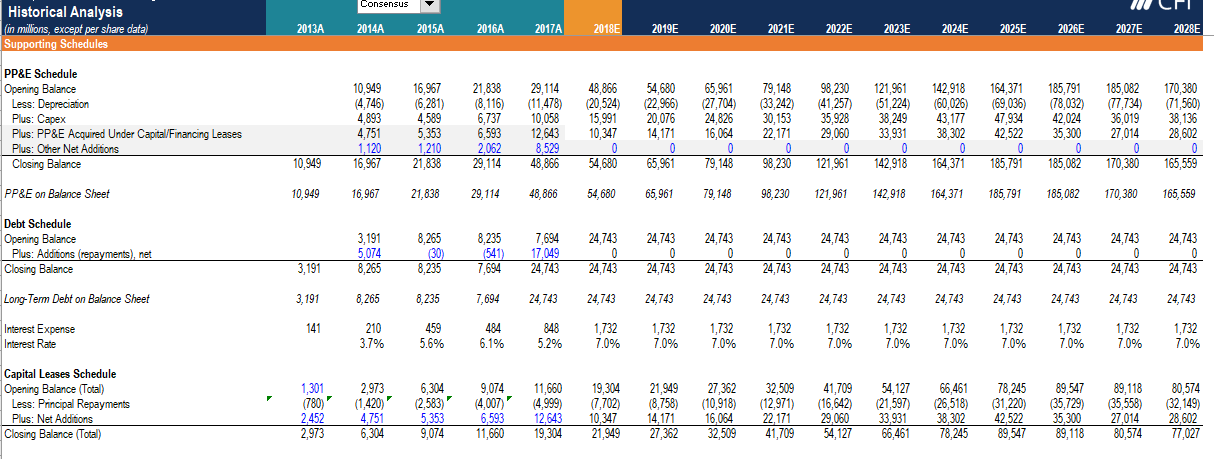
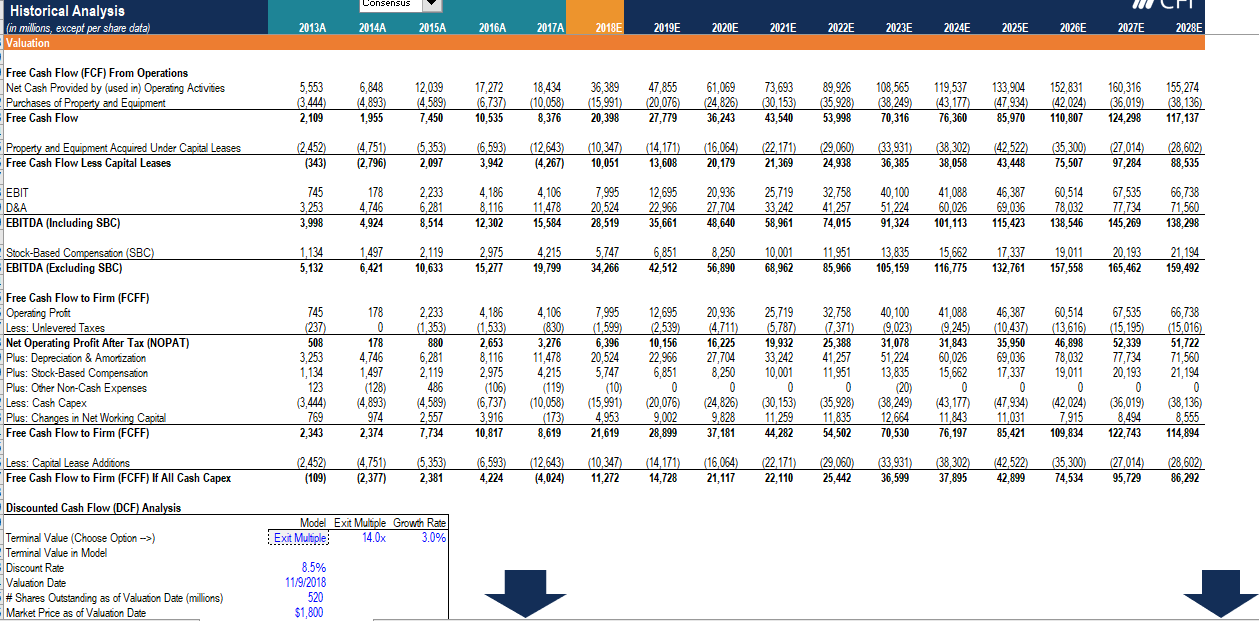
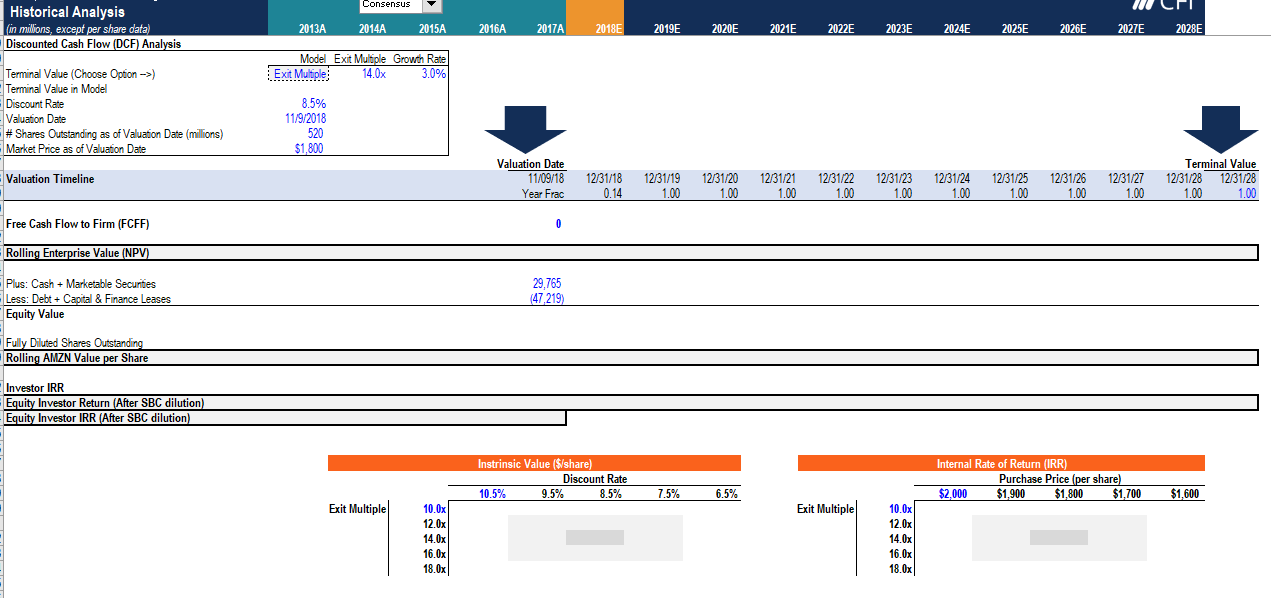
Consensus Historical Analysis (in Millions, except per share data) Income Statement all CFL 2027E 2028E 2013A 2014A 2015A 2016A 2017A 2018E 2019E 2020E 2021E 2022E 2023E 2024E 2025E 2026E 76,863 91,431 130,133 14,541 40,170 407,483 34.336 160,050 22,993 Segmented Revenue Online Stores Physical Stores Retail Third-Party Seller Services Retail Subscription Services AWS Other Total Net Sales 16,086 4,467 7,880 1,710 107,006 108,354 5,798 31,881 9,721 17,459 4,653 177,866 153.948 16,315 50,213 20,590 34,485 19,682 295,232 180,119 18,077 62,264 28,208 46,899 29,523 365,091 210,739 19,723 75,962 36,106 59,562 41,333 443,424 244.457 21,517 91,914 42,96 70,879 56,626 528,359 281,126 23.497 108.458 50,701 82,928 70,216 616,925 317,672 26,011 122,557 56,2 94,538 79,344 696,401 352,616 28,768 137,264 60.217 107,774 86,485 773,124 380,825 31,530 150,991 63,228 119,629 94,268 840,471 431,932 1P 37,152 1P 168,853 69,045 Subs 139,523 Cloud 106,900 Advertising 953,405 12,219 2,950 135,987 24,809 10,935 235,160 130,396 101,810 900,464 74,452 88,988 70,080 18,908 88,988 79,268 27,738 107.006 94,665 41,322 135,987 118,573 59,293 177.866 155,609 79,551 235,160 189.945 105,287 295,232 227,719 137,371 365,091 271,794 171,630 443,424 322,600 205,759 528,359 374,838 242,087 616,925 423,027 273,374 696,401 467,869 305,255 773,124 506,623 333,848 840,471 543,629 356,835 900,464 575,984 377,421 953,405 71,651 13.410 5,254 12,540 1,747 171 88,265 17,619 7,233 16,085 2,432 167 138,744 39,507 11,523 27,514 9,406 470 Income Statement Net Product Sales 60,903 Net Service Sales 13,549 Total Net Sales 74,452 Operating Expenses: Cost of Sales 54,181 Fulfillment 8,585 Marketing 3,133 Technology and Content 6,565 General and Administrative 1,129 Other Operating Expense, net 114 Total Operating Expenses 73,707 Operating Income 745 Interest Income 38 Interest Expense (141) Other Income Expense), net (136) Total Non-Operating Income (Expense) (239) Income Before Income Taxes 506 Provision for Income Taxes (161) Equity-Method Investment Activity, net of tax (71) Net Income 274 Basic Eamings per Share 0.60 Diluted Eamings per Share 0.59 Weighted Average Shares used in Computation of Eamings per Share: Basic 457 Diluted 465 177,139 46.352 14.762 34.837 8,857 590 282,537 12,695 332 (1,732) 217.229 56,589 18,620 43.446 7,541 730 344 155 20,936 522 (1,732) 62,752 10,766 4332 9,275 1,552 133 88,810 178 39 (210) (118) (289) (111) (167) 37 (241) (0.52) (0.52) 263,837 68.731 22,615 52,767 8,868 887 417,706 25,719 776 (1,732) 311,732 82,424 26,946 62,875 10,567 1,057 495,601 32,758 1,081 (1,732) 111,934 25,249 10,069 22,620 3,674 214 173,760 4,106 202 (848 346 (300) 3,806 (769) 4) 3,033 6.32 6.15 363.986 96,857 31,463 70,946 12,339 1,234 576,825 40,100 1,455 (1,732) 414,358 110,031 35,516 80,086 13,928 1,393 655,313 41,088 1,942 (1,732) 460,009 122,154 39.429 88,909 14,689 1,546 726,737 46,387 2441 (1,732) 487.473 132,794 45,385 96,654 15,969 1,681 779.957 60,514 2,988 (1,732) 104.773 522.269 142,273 47,725 101,752 17,109 1,801 832929 67,535 3,739 (1,732) 131,801 560,602 150.638 50,530 104.875 18,115 1,907 886,667 66,738 4.626 (1,732) 227,165 4,186 100 2,233 50 (459) (256) (665) 1,568 (950) (22) 596 1.28 1.25 7,995 205 (1,732) (1,527) 6,469 (1,294) (1,400) 11,295 (2.259) (1,210) 19,726 4,438) (956) 24,762 (5,572) (651) 32,108 (7,224) (277 39,823 (8,960) 210 41,298 (9,292) 708 47,096 (10,597) 1,256 61,770 (13,898) 2,007 69,542 (15,647) 2,894 69,633 (15,667) 90 (294) 3,892 (1,425) (96) 2,371 5.00 4.90 53,895 53,965 5,175 10.67 10.34 9,036 18.45 17.79 15,288 30.91 29.74 19,191 38.42 36.97 24.883 49.32 47.46 30,863 60.57 58.28 32,006 62.19 59.84 36.499 70.22 67.56 TIT 47,872 91.19 87.74 101.65 100.77 97.80 462 462 467 477 474 484 480 493 485 500 490 508 495 514 499 519 504 524 510 530 515 535 520 540 525 546 530 551 536 557 Consensus CEL Historical Analysis (in millions, except per share data) Balance Sheet 2013A 2014A 2015A 2016A 2017A 2018E 2019E 2020E 2021E 2022E 2023E 2024E 2025E 2026E 2027E 2028E 14,557 2,859 8,299 52,239 10,464 29,604 Current Assets: Cash and Cash Equivalents Marketable Securities Inventories Accounts Receivable, net and other Total Current Assets Property And Equipment, net Goodwill Other Assets Total Assets 5612 8,658 3,789 7,411 4,767 24,625 10,949 2,655 1,930 40,159 31,327 16,967 3,319 2,892 54,505 15,890 3,918 10,243 6,423 36,474 21,838 3,759 3,373 65,444 19,334 6,647 11,461 8,339 45,781 29,114 3,784 4,723 83,402 20,522 10,464 16,047 13,164 60,197 48,866 13,350 8,897 131,310 33,217 10,464 23,187 18,684 85,553 54,680 13,360 8,897 162.490 23,457 115,764 65,961 13,360 8,897 203,982 77,564 10,464 36,205 28,928 153,161 79,148 13,360 8,897 254,566 108,134 10,464 44,093 35,231 197,922 98,230 13,360 8,897 318,409 145,490 10,464 52,098 41,979 250,031 121,961 13,360 8,897 394,249 194,209 10,464 60,831 49,016 314,519 142,918 13,380 8,897 479,714 244,051 10,464 69,060 55,179 378,754 164, 371 13,380 8,897 565,402 298,801 10,464 76,878 61,426 447,569 185,791 13,380 8,897 655,637 373,878 10,464 81,468 66,777 532,588 185,082 13,380 8,897 739.947 462,618 10,464 87,283 71,544 631,909 170,380 13,380 8,897 824,566 547,607 10,464 93,434 75,543 727,048 165,559 13,380 8,897 914,883 15,133 6,688 1,159 22.980 3,191 4,242 30,413 LIABILITIES AND STOCKHOLDERS EQUITY Current Liabilities: Accounts Payable Accrued Expenses and Other Uneamed Revenue Total Current Liabilities Long-Term Debt Other Long-Term Liabilites Total Liables Stockholders' Equity: Common Shares - 477 and 484 Treasury Stock, at Cost Additional Paid-In Capital Accumulated Other Comprehensive Loss Retained Earings Total Stockholders' Equity Total Liabilities and Stockholders' Equity 16,459 9,807 1.823 28,089 8,265 7,410 43,764 20,397 10,384 3,118 33,899 8,235 9,926 25,309 13,739 4,768 43,816 7,694 12,607 34,616 18.170 5,097 57,883 24,743 20,975 103,601 42,574 23,516 9.406 75,496 24,743 23,620 123,859 54,355 29,523 11,809 95,688 24,743 29,033 149,464 66,474 36,509 14,604 117,587 24.743 34,180 176,510 80,958 44,342 17,737 143,038 24,743 43,380 211,161 95,655 52,836 21,134 169,625 24,743 55,798 250,166 111,689 61,693 24.677 198,058 24,743 68,132 290,934 126,798 69,640 27,856 224,294 24.743 79,916 328,953 141,153 77,312 30,925 249,391 24,743 91,218 365,352 149,581 84.047 33,619 267.247 24.743 90,789 382,779 160,258 90,046 36,019 286,323 24,743 82,245 393,311 171,550 95,341 38,136 305,027 24,743 78,698 408,468 52,060 64,117 5 5 5 5 (1,837) 27,136 5 (1,837) 33,987 5 (1,837) 64,190 5 (1,837) 93,687 5 (1,837) 9,573 (185) 2,190 9.746 40,159 (1,837) 11,135 (511) 1,949 10,741 54,505 5 (1,837) 13,394 (723) 2,545 13,384 65.444 5 (1,837) 17,186 (985) 4,916 19,285 83,402 5 (1,837) 21,389 (484) 8,636 27,709 131,310 5 (1,837) 52.239 (484) 57 326 107,248 318.409 (1,837) 42,237 (484) 38,135 78,056 254,566 5 (1,837) 111,024 (484) 181,577 290,285 655,637 5 (1,837) 130,036 (484) 229,449 357,168 739,947 (1,837) 78,025 (484) 113,072 188,781 479,714 5 (1,837) 150,229 (484) 283,343 431,256 824,566 13,811 38,631 162,490 5 (1,837) 171,423 (484) 337,309 506,415 914,883 22.847 54,518 203,982 82,209 144,083 394,249 145,078 236,448 565,402 Historical Analysis (in Millions, except per share data) Cash Flow Statement 2013A 2014A 2015A 2016A 2017A 2018E 2019E 2020E 2021E 2022E 2023E 2024E 2025E 2026E 2027E 2028E CASH AND CASH EQUIVALENTS, BEGINNING OF PE 8,084 8,658 14,557 15,890 19,334 20,522 33,217 52,239 77,564 108,134 145,490 194,209 244,051 298,801 373,878 462,618 (241) 596 2,371 3,033 5,175 9,036 15,288 19,191 24,883 30,863 32,006 36,499 47,872 53,895 53,965 4.746 1,497 (128) 6,281 2,119 486 8,116 2,975 (106) 11,478 4,215 (119) 20,524 5,747 (10) 22,966 6,851 0 27,704 8.250 0 33,242 10,001 0 41.257 11,951 0 51,224 13,835 (20) 60,026 15,662 0 69,036 17,337 0 78,032 19,011 77,734 20,193 71,560 21,194 0 0 0 OPERATING ACTIVITIES: Net Income 274 Adjustments to Reconcile Net Income to Net Cash from Operating Activities: Depreciation of Property and Equipment 3,253 Stock-Based Compensation 1,134 Other Non-Cash Operating Expense, net 123 Changes in Operating Assets and Liabilities: Inventories (1,410) Accounts Receivable, net and other (846) Accounts Payable 1,888 Accrued Expenses and Other 736 Uneamed Revenue 401 Net Cash Provided by (used in) Operating Activities 5,553 (1,193) (1,039) 1,759 706 741 6.848 (2,187) (1,755) 4.294 913 1,292 12,039 (1,426 (3 367) 5,030 1,724 1,955 17,272 (3,583) 4,786) 7,175 283 738 18,434 (7,140) (5,520) 7,958 5,346 4,309 36,389 (6,417) (4,773) 11,781 6,007 2,403 47,855 (6,601) (5,471) 12,119 6,986 2,794 61,069 7,889) 6,303) 14,484 7,833 3,133 73,693 (8,004) (6,748) 14,696 8,494 3,397 89,926 (8,733) (7,037) 16,034 8,857 3,543 108,565 (8,229) (6,163) 15,109 7,948 3,179 119,537 (7,818) 6,247) 14,355 7,672 3,069 133,904 4,590) (5,351) 8,427 6,735 2,694 152,831 (5,815) (4,767 10,677 5,999 2,400 160,316 (6,150) (3,999) 11,292 5,294 2,118 155,274 3.444) (4,893) (15,991) (20,076) (24,826) (30,153) 35,928) (38,249) (43,177) 47,934) (42,024) (36,019) (38,136) INVESTING ACTIVITIES: Purchases of Property and Equipment, Including Internal-Use Proceeds from Property and Equipment Incentives Acquisitions, net of cash acquired, and other Sales (Purchases) of Marketable Securites, net Net Cash Provided by (used in) Investing Activities 15,387) 798 (795) (1,066) (6,450) (7,804) 1,067 (116) 3,023) (9,876) 0 (11,955) 1,897 (13,972) 3.789) (27,819) 0 0 (312) (520) (4.276) 0 (979) 807 (5,065) 0 0 0 0 (20,076) 0 (15,991) 0 0 (24.826) 0 0 (35,928) 0 (30,153) 0 0 (38,249) 0 0 0 (47,934) 0 (43,177) (42,024) 0 (36,019) (38,136) 0 0 0 163 (775) (5) 0 7,702) 0 (8,758) (1,299) (2,462) (121) 0 0 (35,558) 267 (3,860) (147) 0 0 (12,971) (10,918) (16,642) 0 (26,518) (21,597) FINANCING ACTIVITIES: Proceeds (Repayments) from Long-Term Debt and Other Principal Repayments of Capital Lease Obligations Principal Repayments of Finance Lease Obligations Proceeds from Issuing Equity (Common, Treasury, Paid-in, et Payment of Dividends Net Cash Provided by (used in) Financing Activities (31,220) (35,729) 5,846 (1,285) (135) 0 0 4,426 0 (32,149) 14,859 4,799) (200) 0 0 9,860 0 0 0 0 0 0 0 (7.702) 0 0 0 (12,971) 0 0 (26,518) 0 0 (31,220) 0 0 (35,558) 0 0 (32,149) (617) (3,882) (3,740) (8,758) (10,918) (16,642) (21,597) (35,729) Foreign Currency Effect on Cash and Cash Equivalents Net Increase (Decrease) in Cash and Cash Equivalents (86) 574 (310) 5,899 374) 1,333 (212) 3.444 713 1,188 12,695 19,021 25,326 30,569 37,356 48,719 49,842 54,750 75,078 88,740 84,989 CASH AND CASH EQUIVALENTS, END OF PERIOD 8,658 14,557 15,890 19,334 20,522 33,217 52,239 77,564 108,134 145,490 194,209 244,051 298,801 373,878 462,618 547,607 Consensus Historical Analysis in millions, except per share data) Supporting Schedules 2013A 2014A 2015A 2016A 2017A 2018E 2019E 2020E 2021E 2022E 2023E 2024E 2025E 2026E 2027E 2028E 164 371 PP&E Schedule Opening Balance Less: Depreciation Plus: Capex Plus: PP&E Acquired Under Capital/Financing Leases Plus: Other Net Additions Closing Balance 10,949 (4,746) 4,893 4,751 1,120 16,967 16,967 (6,281) 4,589 5,353 1,210 21,838 21,838 (8,116) 6,737 6,593 2062 29,114 29,114 (11,478) 10,058 12.643 8,529 48.866 48,866 (20,524) 15,991 10,347 54,680 (22,966) 20,076 14.171 65,961 (27,704) 24,826 16,064 79,148 (33,242) 30,153 22.171 98.230 (41,257) 35,928 29,060 121,961 (51,224) 38,249 33,931 142,918 (60,026) 43,177 38,302 (69,036) 47,934 42,522 0 185,791 185,791 (78,032) 42,024 35,300 185,082 (77,734) 36,019 27,014 170,380 (71,560) 38,136 28,602 0 165,559 0 0 0 0 10,949 54.680 65,961 79,148 98,230 121,961 142,918 164,371 185,082 170,380 PP&E on Balance Sheet 10,949 16,967 21,838 29, 114 48,866 54, 680 65,961 79.148 98,230 121,961 142,918 164,371 185,791 185,082 170,380 165,559 8.235 24,743 24743 24,743 24,743 24.743 Debt Schedule Opening Balance Plus: Additions (repayments), net Closing Balance 3,191 5,074 8,265 8.265 (30) 8,235 7,694 17,049 24,743 24,743 0 24,743 24,743 0 24,743 24.743 0 24,743 24,743 0 24,743 24,743 0 24,743 24.743 0 24,743 3,191 7,694 24,743 24,743 24,743 24,743 24,743 Long-Term Debt on Balance Sheet 3,191 8,265 8.235 7,694 24,743 24,743 24,743 24.743 24,743 24,743 24,743 24,743 24,743 24,743 24,743 24,743 141 Interest Expense Interest Rate 210 3.7% 459 5.6% 484 6.1% 848 5.2% 1,732 7.0% 1,732 7.0% 1,732 7.0% 1,732 7.0% 1,732 7.0% 1,732 7.0% 1,732 7.0% 1,732 7.0% 1,732 7.0% 1,732 7.0% 1,732 7.0% Capital Leases Schedule Opening Balance (Total) Less: Principal Repayments Plus: Net Additions Closing Balance (Total) 1,301 (780) 2,452 2,973 2,973 (1,420) 4,751 6,304 6,304 (2,583) 5,353 9,074 9,074 (4,007) 6,593 11,660 11,660 4,999) 12.643 19,304 19,304 7,702) 10,347 21,949 21,949 (8,758) 14,171 27,362 27,362 (10,918) 16,064 32,509 32,509 (12,971) 22,171 41,709 41,709 (16,642) 29,060 54,127 (21,597) 33,931 66,461 66,461 (26,518) 38,302 78,245 78,245 31,220) 42 522 89,547 89,547 (35,729) 35,300 89,118 89,118 (35,558) 27,014 80,574 80,574 (32,149) 28,602 54,127 77,027 Consensus Historical Analysis (in Millions, except per share data Valuation 2013A 2014A 2015A 2016A 2017A 2018E 2019E 2020E 2021E 2022E 2023E 2024E 2025E 2026E 2027E 2028E Free Cash Flow (FCF) From Operations Net Cash Provided by (used in) Operating Activities Purchases of Property and Equipment Free Cash Flow 5,553 3.444) 2,109 6,848 4,893) 1,955 12,039 4,589) 7,450 17,272 (6,737) 10,535 18,434 (10,058) 8,376 36,389 (15,991) 20,398 47,855 (20,076) 27.779 61,069 (24,826) 36,243 73,693 (30,153) 43,540 89,926 (35,928) 53,998 108,565 (38,249) 70,316 119,537 (43,177) 76,360 133,904 (47.934) 85,970 152,831 (42,024) 110,807 160,316 36,019) 124,298 155,274 (38,136) 117,137 Property and Equipment Acquired Under Capital Leases Free Cash Flow Less Capital Leases 2,452) (343) 4,751) (2,796) 5,353) 2,097 6,593) 3,942 (12,643) (4,267) (10,347) 10.051 (14,171) 13,608 (16,064) 20,179 (22,171) 21,369 (29,060) 24,938 (33,931) 36,385 (38,302) 38,058 (42.522) 43,448 (35,300) 75,507 (27,014) 97,284 (28,602) 88,535 EBIT D&A EBITDA (Including SBC) 745 3,253 3,998 178 4.746 4,924 2,233 6,281 8,514 4,186 8,116 12,302 4,106 11.478 15,584 7,995 20,524 28,519 12,695 22,966 35,661 20,936 27,704 48,640 25,719 33,242 58,961 32,758 41,257 74,015 40,100 51,224 91,324 41,088 60,026 101,113 46,387 69,036 115,423 60,514 78,032 138,546 67,535 77.734 145,269 66,738 71,560 138,298 Stock-Based Compensation (SBC) EBITDA (Excluding SBC) 1,134 5,132 1,497 6,421 2,119 10,633 2,975 15,277 4,215 19,799 5.747 34,266 6,851 42,512 8,250 56,890 10,001 68,962 11,951 85,966 13,835 105,159 15,662 116.775 17,337 132,761 19,011 157,558 20,193 165,467 21,194 159.492 Free Cash Flow to Firm (FCFF) Operating Profit Less: Unlevered Taxes Net Operating Profit After Tax (NOPAT) Plus: Depreciation & Amortization Plus: Stock-Based Compensation Plus: Other Non-Cash Expenses Less: Cash Capex Plus: Changes in Net Working Capital Free Cash Flow to Firm (FCFF) 745 (237) 508 3,253 1,134 123 3,444) 769 2,343 178 0 178 4.746 1,497 (128) 4,893) 974 2,374 2,233 (1,353) 880 6,281 2,119 486 (4,589) 2,557 7,734 4,186 (1,533) 2,653 8,116 2,975 (106) 6,737) 3,916 10,817 4,106 (830) 3.276 11,478 4,215 (119) (10,058) (173) 8.619 7,995 (1,599) 6,396 20,524 5,747 (10) (15,991) 4,953 21,619 12,695 (2.539) 10,156 22,966 6,851 0 (20,076) 9,002 28,899 20,936 4,711) 16,225 27,704 8,250 0 (24,826) 9,828 37,181 25,719 5,787) 19,932 33,242 10,001 0 (30,153) 11,259 44,282 32,758 (7,371) 25,388 41,257 11,951 0 (35,928) 11,835 54,502 40,100 9,023) 31,078 51,224 13,835 (20) (38,249) 12,664 70,530 41,088 (9,245) 31,843 60,026 15,662 0 (43,177) 11,843 76,197 46,387 (10,437 35,950 69,036 17,337 0 (47,934) 11,031 60,514 (13,616) 46,898 78,032 19.011 0 (42,024) 7,915 109.834 67 535 (15,195) 52,339 77,734 20,193 0 (36,019) 8,494 122,743 66,738 (15,016) 51,722 71,560 21,194 0 (38,136) 85,421 8,555 114,894 Less: Capital Lease Additions Free Cash Flow to Firm (FCFF) If All Cash Capex (2,452) (109) 6,593) (4,751) (2,377) (5.353) 2,381 (12,643) (4,024) (10,347) 11,272 (14,171) 14,728 (16,064) 21,117 (22,171) 22.110 (29,060) 25,442 33.931) 36,599 (38,302) 37.895 (42 522) 42,899 (35,300) 74,534 27.014) 95,729 (28,602) 86,292 4,224 Discounted Cash Flow (DCF) Analysis Model Exit Multiple Growth Rate Exit Multiple 14.0x 3.0% Terminal Value (Choose Option -> Terminal Value in Model Discount Rate Valuation Date # Shares Outstanding as of Valuation Date (millions) Market Price as of Valuation Date 8.5% 11/9/2018 520 $1,800 Consensus Historical Analysis (in millions, except per share data) Discounted Cash Flow (DCF) Analysis 2013A 2014A 2015A 2016A 2017A 2018E 2019E 2020E 2021E 2022E 2023E 2024E 2025E 2026E 2027E 2028E Model Exit Multiple Growth Rate : Exit Multiple 3.0% 14.0x Terminal Value (Choose Option ->) Terminal Value in Model Discount Rate Valuation Date # Shares Outstanding as of Valuation Date (millions) Market Price as of Valuation Date 8.5% 11/9/2018 520 $1,800 Valuation Timeline Valuation Date 11/09/18 Year Frac 12/31/26 12/31/18 0.14 12/31/19 1.00 12/31/20 1.00 12/31/21 1.00 12/31/22 1.00 12/31/23 1.00 12/31/24 1.00 12/31/25 1.00 Terminal Value 12/31/28 12/31/28 1.00 1.00 12/31/27 1.00 1.00 Free Cash Flow to Firm (FCFF) 0 Rolling Enterprise Value (NPV) Plus: Cash + Marketable Securities Less: Debt Capital & Finance Leases 29,765 (47,219) Equity Value Fully Diluted Shares Outstanding Rolling AMZN Value per Share Investor IRR Equity Investor Return (After SBC dilution) Equity Investor IRR (After SBC dilution) Instrinsic Value ($/share) Discount Rate 10.5% 9.5% 8.5% Internal Rate of Return (IRR) Purchase Price (per share) $2,000 $1,900 $1,800 $1,700 7.5% 6.5% $1,600 Exit Multiple Exit Multiple 10.0x 12.0x 14.0x 16.0x 18.0x 10.0x 12.0x 14.0x 16.0x 18.0x
Step by Step Solution
There are 3 Steps involved in it

Get step-by-step solutions from verified subject matter experts