

Question: 1. what is the most suitable functional form for the data: linear, quadratic, cubic? 2. what is the best trend line? on my graph I
1. what is the most suitable functional form for the data: linear, quadratic, cubic? 2. what is the best trend line? on my graph I used a polynomial but I don't know if that's correct.
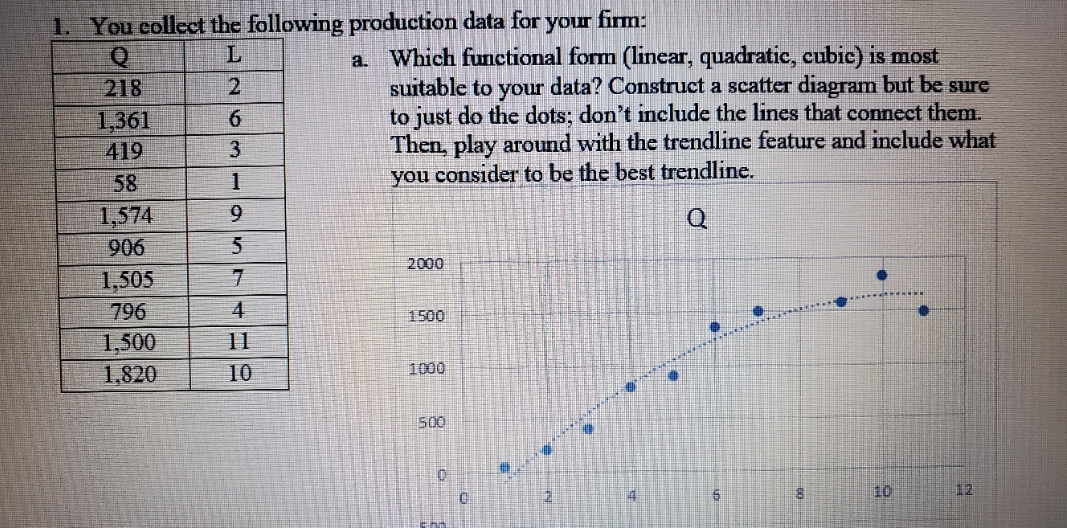
1. You collect the following production data for your firm: Q L a. Which functional form (linear, quadratic, cubic) is most 218 suitable to your data? Construct a scatter diagram but be sure 1,361 6 to just do the dots; don't include the lines that connect them. 419 3 Then, play around with the trendline feature and include what 58 you consider to be the best trendline. 1,574 Q 906 2000 1,505 7 796 4 1500 1,500 11 1,820 10 1000 500 5 12
Step by Step Solution
There are 3 Steps involved in it
1 Expert Approved Answer
Step: 1 Unlock

Question Has Been Solved by an Expert!
Get step-by-step solutions from verified subject matter experts
Step: 2 Unlock
Step: 3 Unlock