

Question: 1. What observations can you make about the demand pattern, just from looking at it? Do you see any patterns? 2. Is this forecast accurate?
1. What observations can you make about the demand pattern, just from looking at it? Do you see any patterns?
2. Is this forecast accurate? Is it biased? How did you dra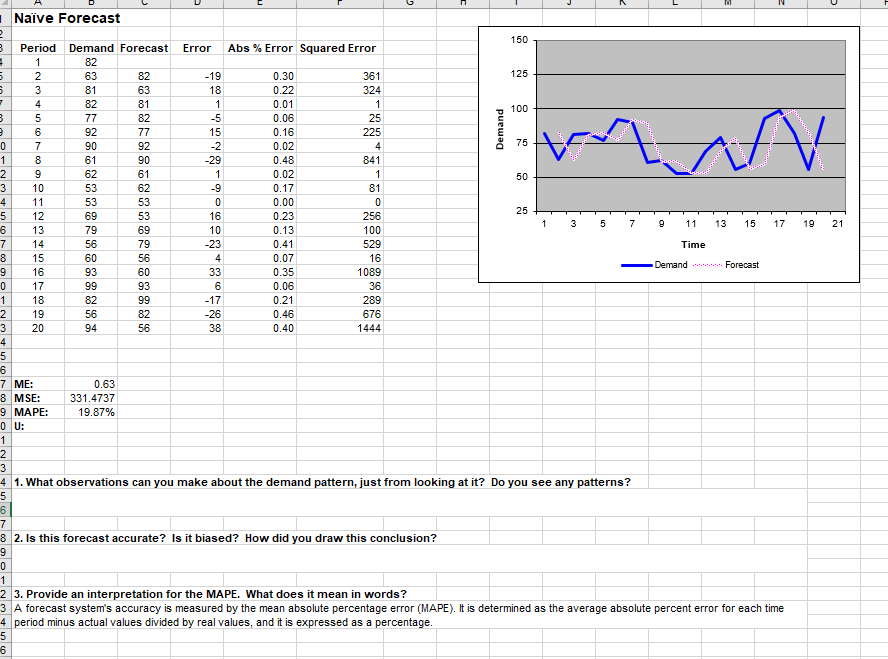 w this conclusion?
Step by Step Solution
There are 3 Steps involved in it
1 Expert Approved Answer
Step: 1 Unlock

Question Has Been Solved by an Expert!
Get step-by-step solutions from verified subject matter experts
Step: 2 Unlock
Step: 3 Unlock