

Question: 1. What two graphs are used to display qualitative data? 2. Make a stem and leaf plot of the heights (in inches) of 2013 OSU
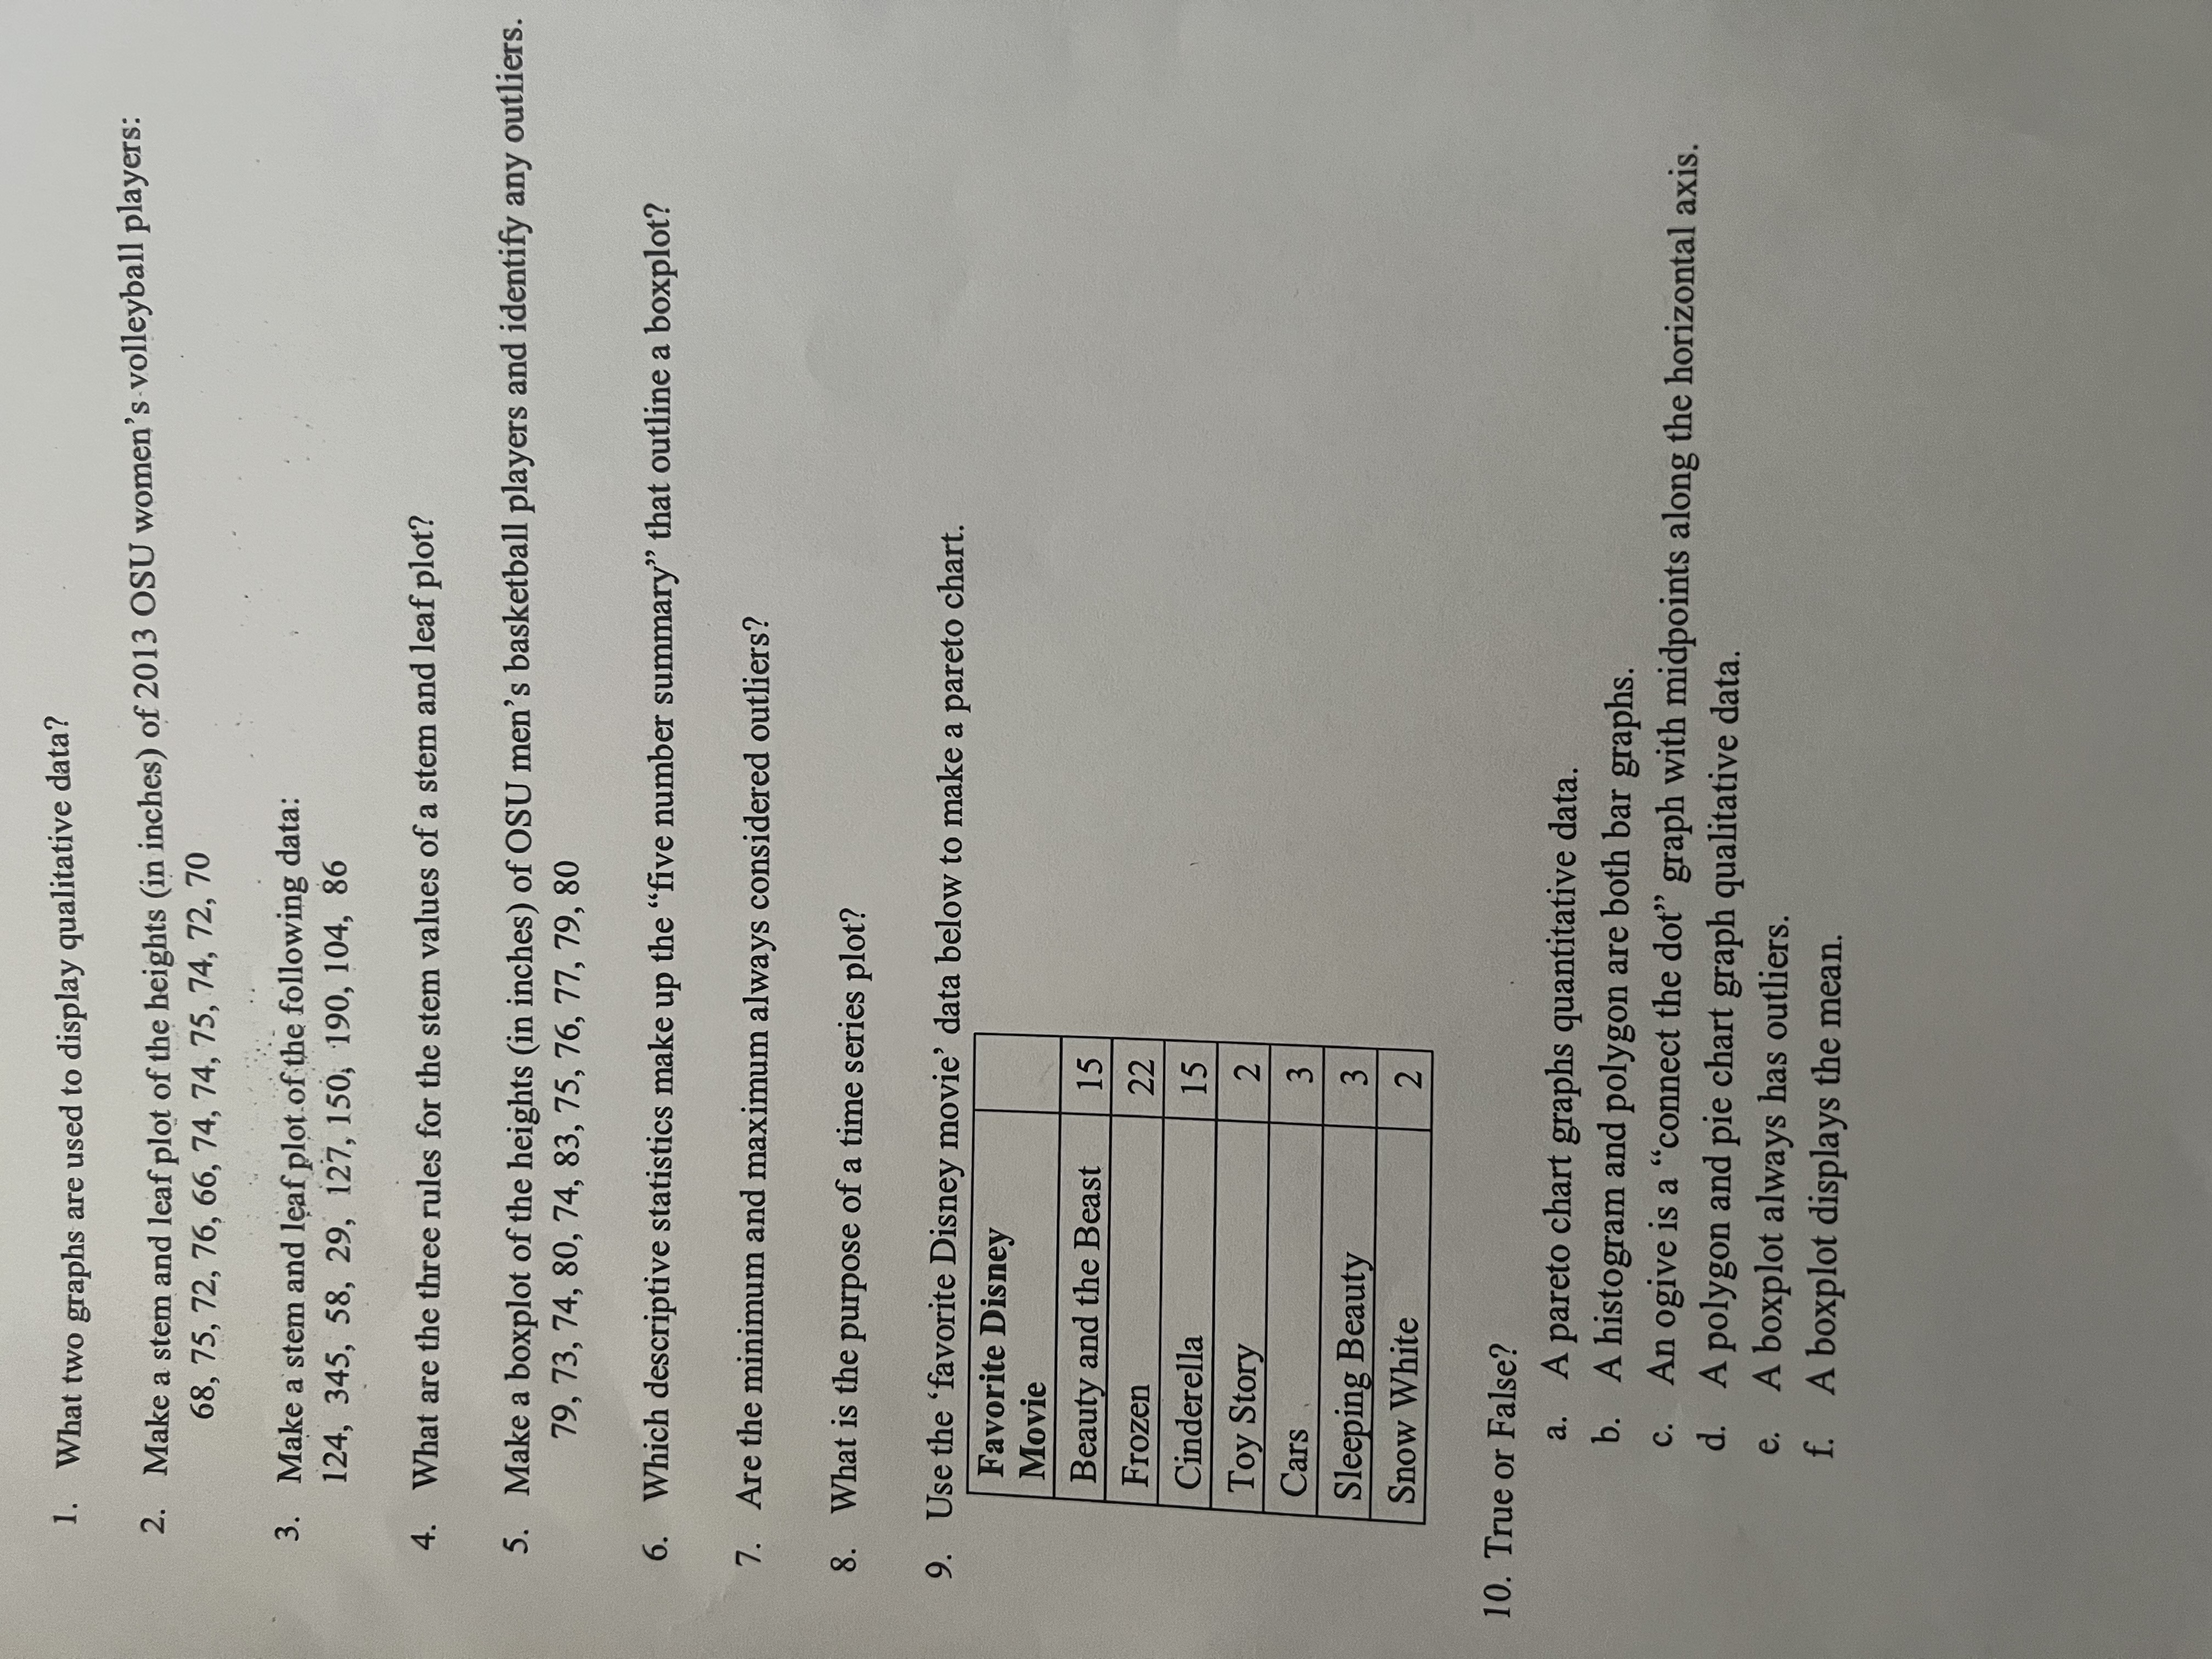
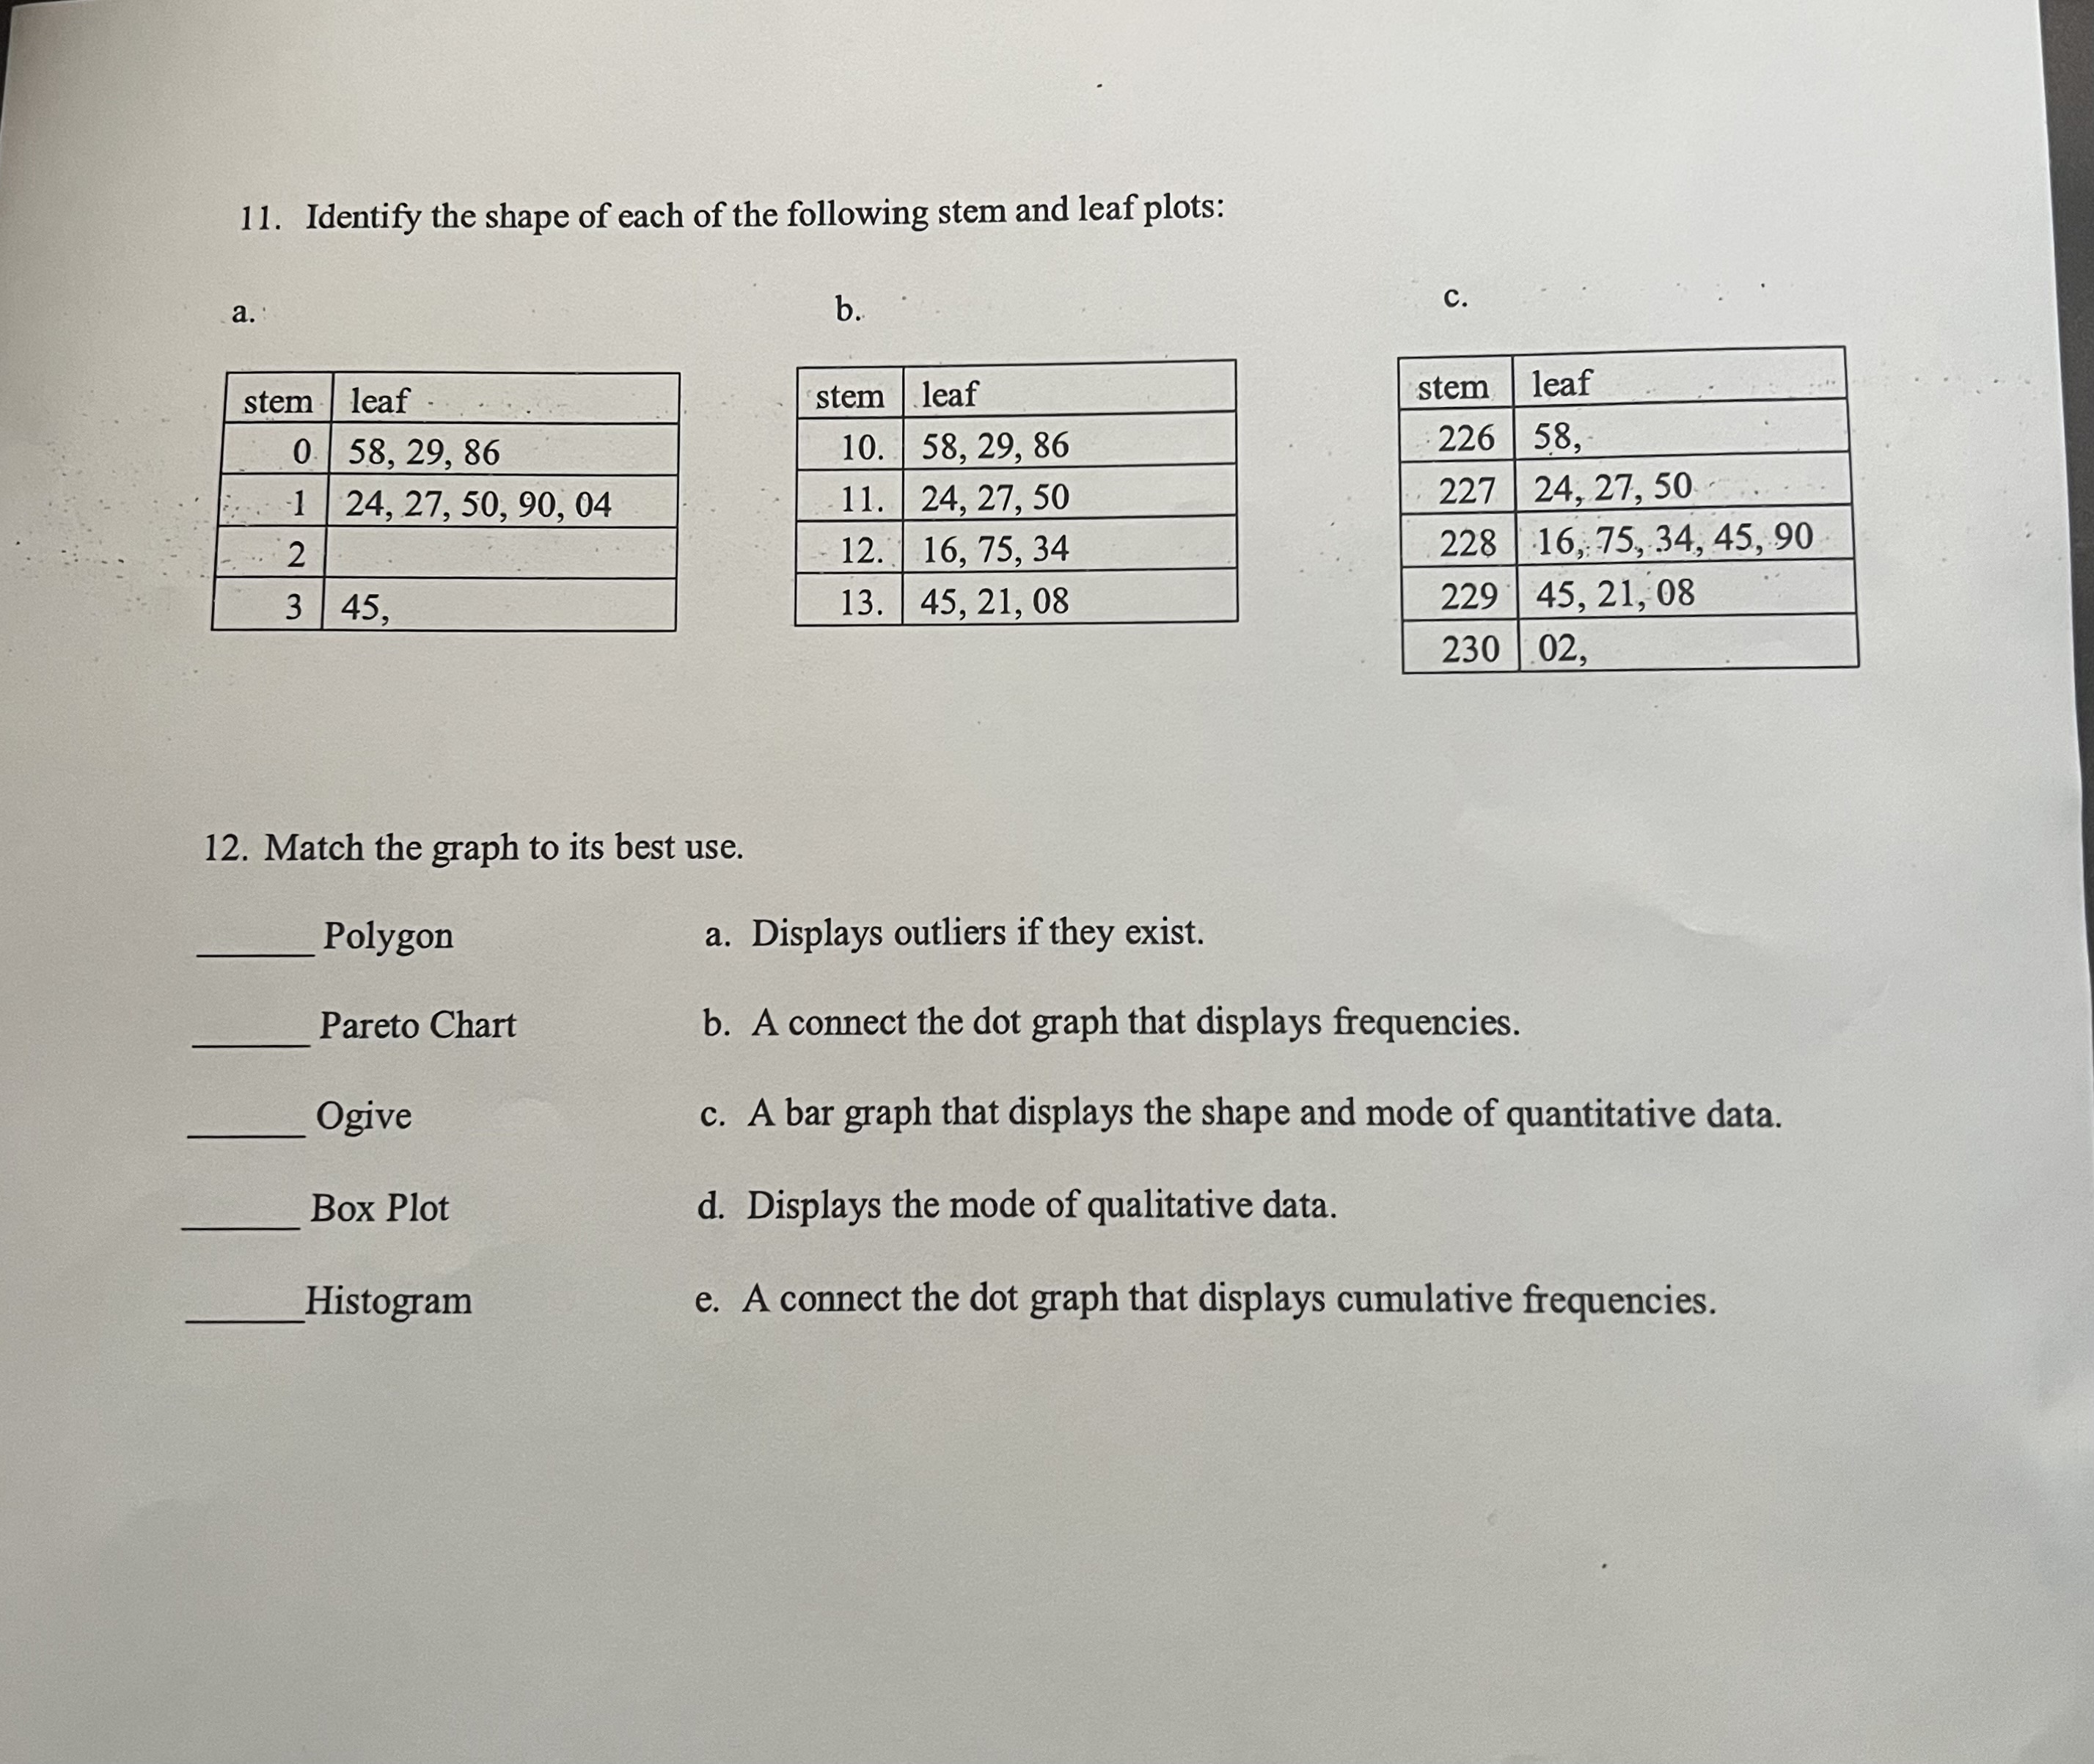
1. What two graphs are used to display qualitative data? 2. Make a stem and leaf plot of the heights (in inches) of 2013 OSU women's volleyball players: 68, 75, 72, 76, 66, 74, 74, 75, 74, 72, 70 3. Make a stem and leaf plot of the following data: 124, 345, 58, 29, 127, 150, 190, 104, 86 4. What are the three rules for the stem values of a stem and leaf plot? 5. Make a boxplot of the heights (in inches) of OSU men's basketball players and identify any outliers. 79, 73, 74, 80, 74, 83, 75, 76, 77, 79, 80 6. Which descriptive statistics make up the "five number summary" that outline a boxplot? 7. Are the minimum and maximum always considered outliers? 8. What is the purpose of a time series plot? 9. Use the 'favorite Disney movie' data below to make a pareto chart. Favorite Disney Movie Beauty and the Beast 15 Frozen 22 Cinderella 15 Toy Story 2 Cars 3 Sleeping Beauty 3 Snow White 2 10. True or False? a. A pareto chart graphs quantitative data. b. A histogram and polygon are both bar graphs. c. An ogive is a "connect the dot" graph with midpoints along the horizontal axis. d. A polygon and pie chart graph qualitative data. e. A boxplot always has outliers. f. A boxplot displays the mean.11. Identify the shape of each of the following stem and leaf plots: a. b. C. stem leaf - stem .leaf stem leaf 58, 29, 86 10. 58, 29, 86 226 58, . 1 24, 27, 50, 90, 04 11. 24, 27, 50 227 24, 27, 50 2 12. 16, 75, 34 228 16, 75, 34, 45, 90 3 45, 13. 45, 21, 08 229 45, 21, 08 230 02, 12. Match the graph to its best use. Polygon a. Displays outliers if they exist. Pareto Chart b. A connect the dot graph that displays frequencies. Ogive c. A bar graph that displays the shape and mode of quantitative data. Box Plot d. Displays the mode of qualitative data. Histogram e. A connect the dot graph that displays cumulative frequencies
Step by Step Solution
There are 3 Steps involved in it

Get step-by-step solutions from verified subject matter experts