

Question: 1. What were the yields on the two representative outstanding Heinz-debt issues as of the end of April 2010? What were they one year earlier?
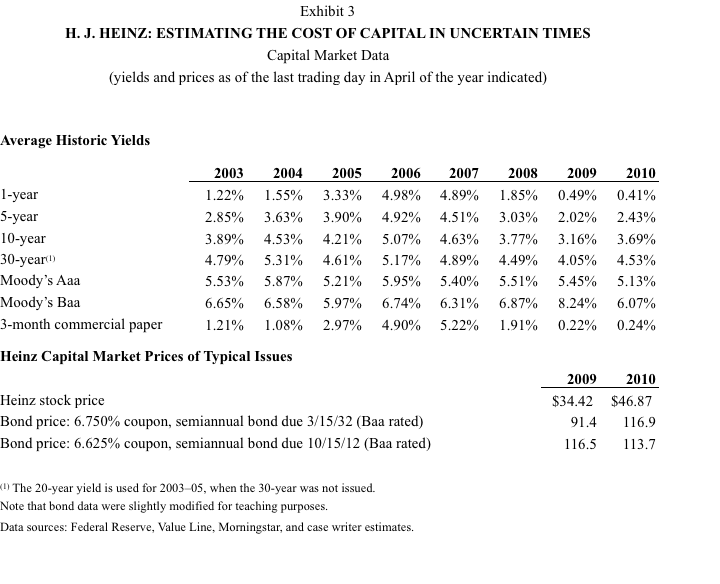
1. What were the yields on the two representative outstanding Heinz-debt issues as of the end of April 2010? What were they one year earlier?
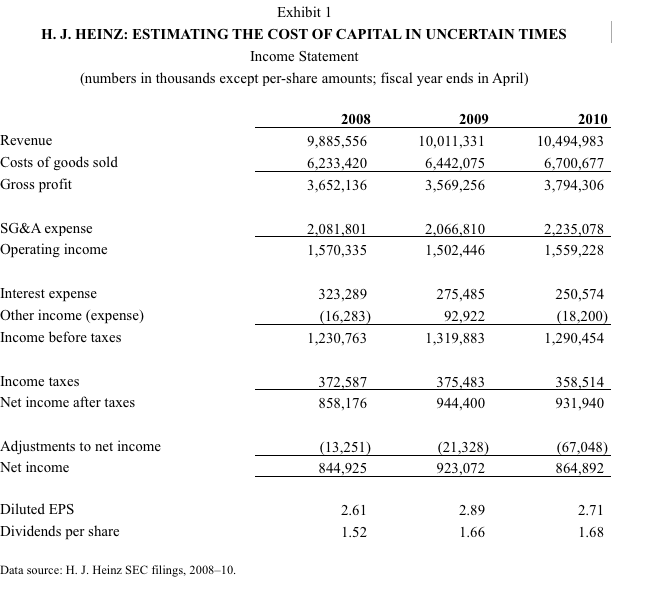
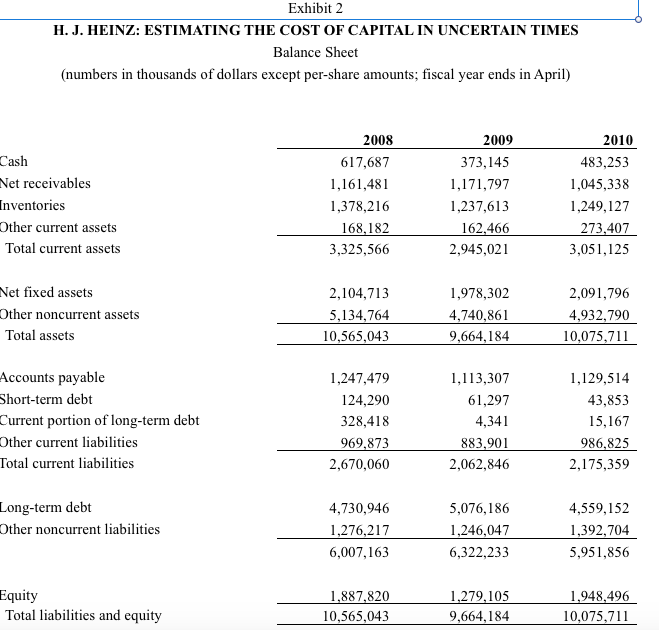
2. What was the WACC for Heinz at the start of fiscal year 2010? What was the WACC one year earlier?
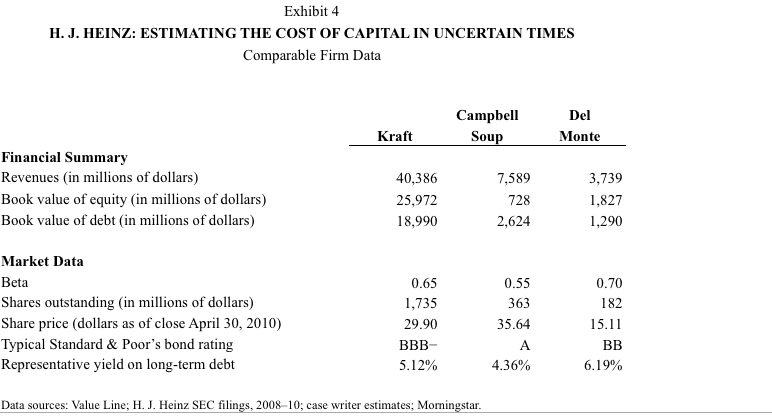
3. What is your best estimate of the WACC for Kraft Foods, Campbell Soup Company, and Del Monte Foods? How do these WACCs influence your thinking about the WACC for Heinz?
Exhibit 1 H. J. HEINZ: ESTIMATING THE COST OF CAPITAL IN UNCERTAIN TIMES Income Statement (numbers in thousands except per-share amounts; fiscal year ends in April) Revenue Costs of goods sold Gross profit 2008 9,885,556 6,233,420 3,652,136 2009 10,011,331 6,442,075 3,569,256 2010 10,494,983 6,700,677 3,794,306 SG&A expense Operating income 2.066810 1,502,446 2,081,801 2,235,078 1,570,335 1,559,228 Interest expense Other income (expense) Income before taxes 323,289 16,283) 1,230,763 275,485 92,922 1,319,883 250,574 (18,200) 1,290,454 358,514 931,940 Income taxes 372,587 858,176 375.483 Net income after taxes 944,400 Adjustments to net income Net income (13,251) 844,925 21,328 923,072 67,048) 864,892 2.61 1.52 2.71 1.68 Diluted EPS 2.89 1.66 Dividends per share Data source: H. J. Heinz SEC filings, 2008-10. Exhibit 4 H. J. HEINZ: ESTIMATING THE COST OF CAPITAL IN UNCERTAIN TIMES Comparable Firm Data Campbell Sou Del Monte Kraft Financial Summarv Revenues (in millions of dollars) Book value of equity (in millions of dollars) Book value of debt (in millions of dollars) 40,386 25,972 18,990 7,589 728 2,624 3,739 1,827 1,290 Market Data Beta Shares outstanding (in millions of dollars) Share price (dollars as of close April 30, 2010) Typical Standard & Poor's bond rating Representative yield on long-term debt 0.65 1,735 29.90 0.55 363 35.64 0.70 182 15.11 5.12% 4.36% 619% Data sources: Value Line: H. J. Heinz SEC filings, 2008 10; case writer estimates: Momingstar Exhibit 1 H. J. HEINZ: ESTIMATING THE COST OF CAPITAL IN UNCERTAIN TIMES Income Statement (numbers in thousands except per-share amounts; fiscal year ends in April) Revenue Costs of goods sold Gross profit 2008 9,885,556 6,233,420 3,652,136 2009 10,011,331 6,442,075 3,569,256 2010 10,494,983 6,700,677 3,794,306 SG&A expense Operating income 2.066810 1,502,446 2,081,801 2,235,078 1,570,335 1,559,228 Interest expense Other income (expense) Income before taxes 323,289 16,283) 1,230,763 275,485 92,922 1,319,883 250,574 (18,200) 1,290,454 358,514 931,940 Income taxes 372,587 858,176 375.483 Net income after taxes 944,400 Adjustments to net income Net income (13,251) 844,925 21,328 923,072 67,048) 864,892 2.61 1.52 2.71 1.68 Diluted EPS 2.89 1.66 Dividends per share Data source: H. J. Heinz SEC filings, 2008-10. Exhibit 4 H. J. HEINZ: ESTIMATING THE COST OF CAPITAL IN UNCERTAIN TIMES Comparable Firm Data Campbell Sou Del Monte Kraft Financial Summarv Revenues (in millions of dollars) Book value of equity (in millions of dollars) Book value of debt (in millions of dollars) 40,386 25,972 18,990 7,589 728 2,624 3,739 1,827 1,290 Market Data Beta Shares outstanding (in millions of dollars) Share price (dollars as of close April 30, 2010) Typical Standard & Poor's bond rating Representative yield on long-term debt 0.65 1,735 29.90 0.55 363 35.64 0.70 182 15.11 5.12% 4.36% 619% Data sources: Value Line: H. J. Heinz SEC filings, 2008 10; case writer estimates: Momingstar
Step by Step Solution
There are 3 Steps involved in it

Get step-by-step solutions from verified subject matter experts