

Question: 1. What would be the best chart to construct to monitor how consistent the production process is? With 3 sigma limits: UCL for x-bar? First
1. What would be the best chart to construct to monitor how consistent the production process is?
With 3 sigma limits: UCL for x-bar? First point plotted on the x-bar has a value of? Value of center line for the chart that monitors performance to target?
2. The center line of the R-chart is?
3. is the process in control, out of control or capable?
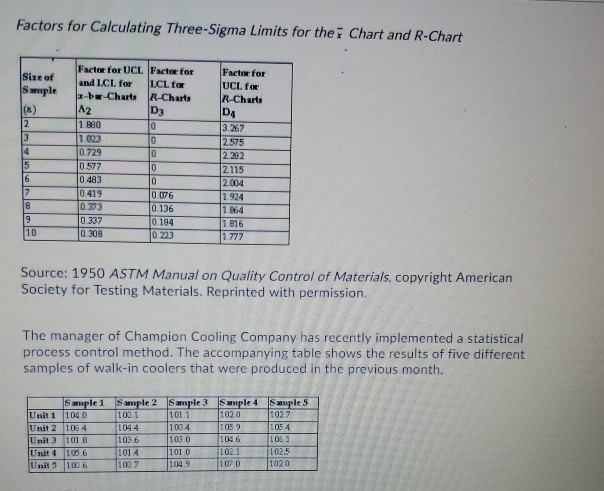
Factors for Calculating Three-Sigma Limits for the Chart and R-Chart Size of Sample (1) 2 3 4 Factor for UCL Factor for and LCL for LCLO -bw-Charts R-Charts A2 D3 1.890 0 1.023 0 0.729 0 0.577 0 0.483 0 0.419 0.076 0.373 0.136 0.337 0 194 0 308 0.223 Factor for UCL for R-Charts D4 3.267 2.575 2282 2115 2.004 1.924 1.864 1.816 1.772 15 6 7 18 19 10 Source: 1950 ASTM Manual on Quality Control of Materials, copyright American Society for Testing Materials. Reprinted with permission. The manager of Champion Cooling Company has recently implemented a statistical process control method. The accompanying table shows the results of five different samples of walk-in coolers that were produced in the previous month. Sample 1 Unit 1 104.0 Unit 2 105 4 Unit 3 101.8 Unit 105.6 Unit 3 100.6 Sample 2 Sample 3 100.1 1011 104.4 1004 1036 1030 1014 1049 Sample 4 Sample 5 1020 1027 1059 1054 1046 105.2 102.1 102.5 1070 1020 1010 100Step by Step Solution
There are 3 Steps involved in it
1 Expert Approved Answer
Step: 1 Unlock

Question Has Been Solved by an Expert!
Get step-by-step solutions from verified subject matter experts
Step: 2 Unlock
Step: 3 Unlock