

Question: 1. What would be the revised net operating income per month if the sales volume increases by 70 units? 2. What would be the revised
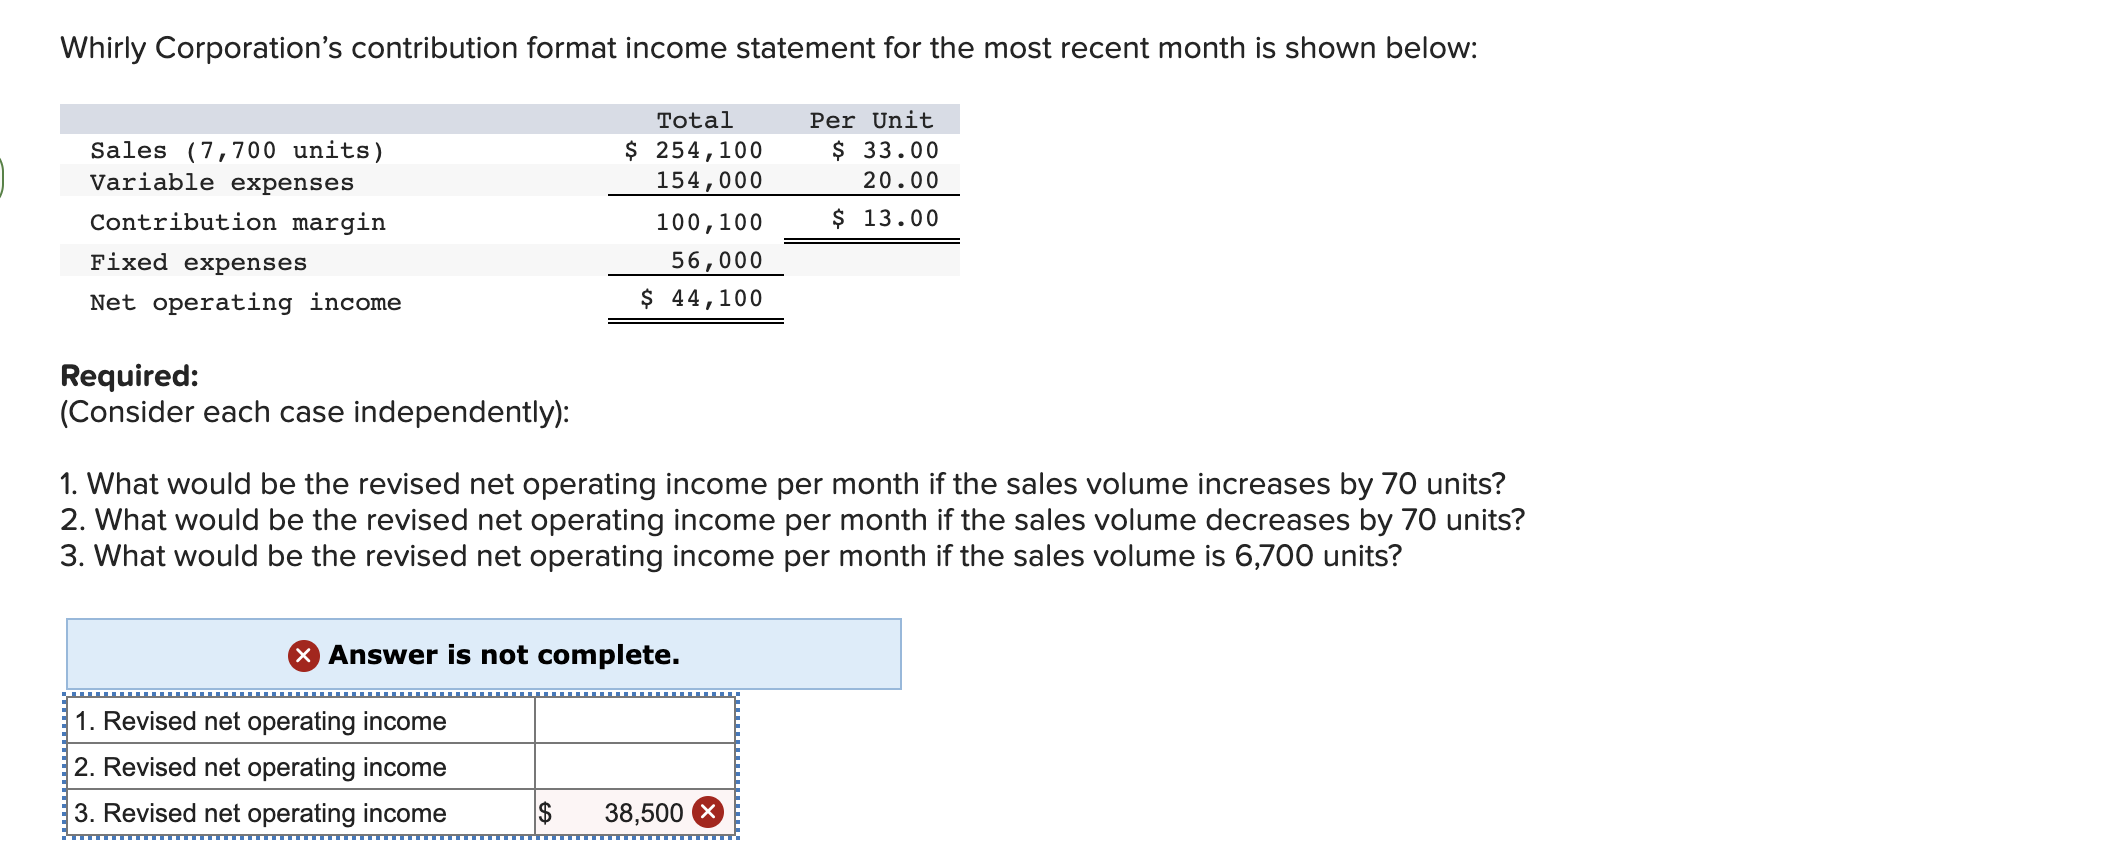
1. What would be the revised net operating income per month if the sales volume increases by 70 units?
2. What would be the revised net operating income per month if the sales volume decreases by 70 units?
3. What would be the revised net operating income per month if the sales volume is 6,700 units?
2. Calculate the companys break-even point in unit sales.
Jaffre Enterprises distributes a single product whose selling price is $16 per unit and whose variable expense is $11 per unit. The companys fixed expense is $16,000 per month.
Calculate the companys break-even point in unit sales.
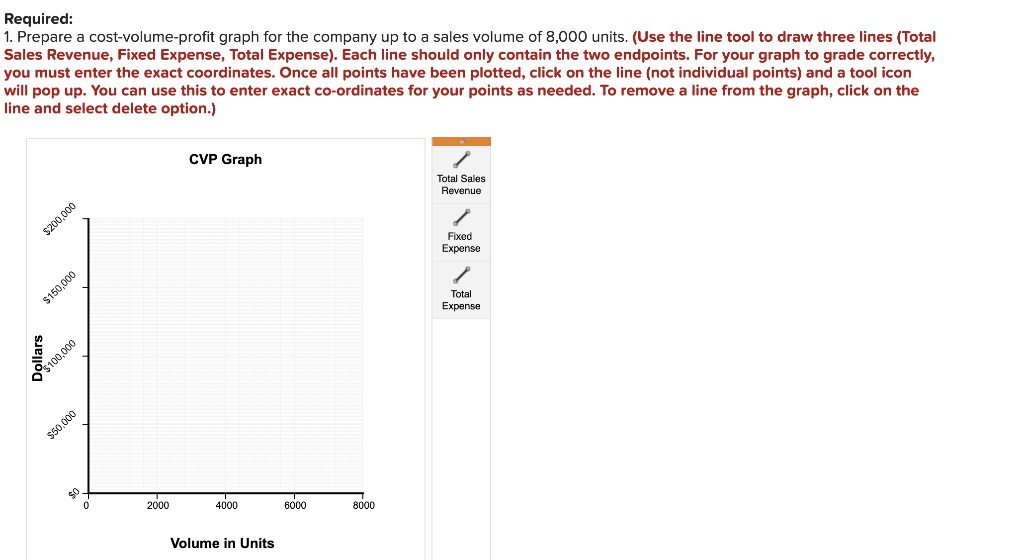
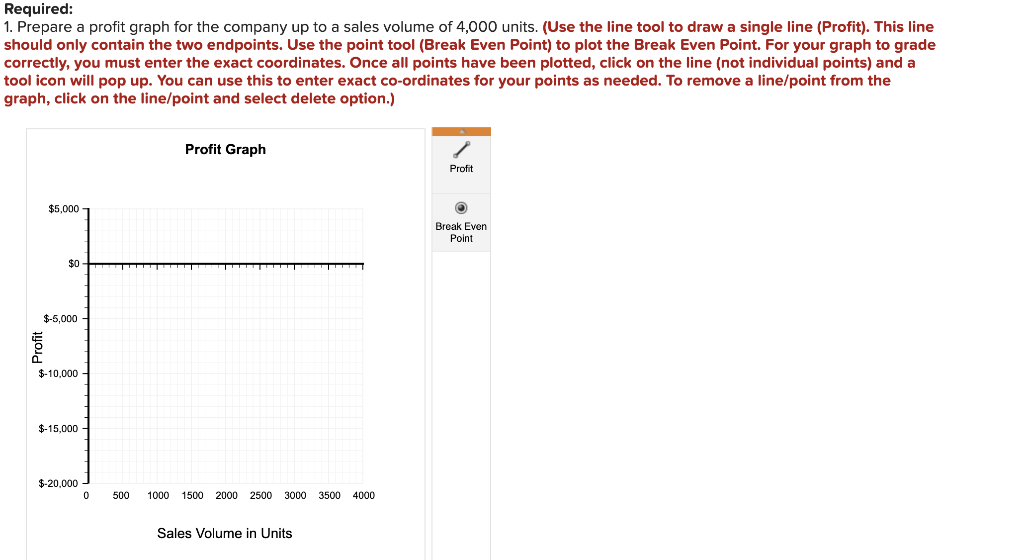
Whirly Corporation's contribution format income statement for the most recent month is shown below: Total Sales (7,700 units) Per Unit $ 33.00 20.00 Variable expenses Contribution margin $ 254,100 154,000 100, 100 56,000 $ 13.00 Fixed expenses Net operating income $ 44,100 Required: (Consider each case independently): 1. What would be the revised net operating income per month if the sales volume increases by 70 units? 2. What would be the revised net operating income per month if the sales volume decreases by 70 units? 3. What would be the revised net operating income per month if the sales volume is 6,700 units? X Answer is not complete. 1. Revised net operating income 2. Revised net operating income 3. Revised net operating income $ 38,500 X Required: 1. Prepare a cost-volume-profit graph for the company up to a sales volume of 8,000 units. (Use the line tool to draw three lines (Total Sales Revenue, Fixed Expense, Total Expense). Each line should only contain the two endpoints. For your graph to grade correctly, you must enter the exact coordinates. Once all points have been plotted, click on the line (not individual points) and a tool icon will pop up. You can use this to enter exact co-ordinates for your points as needed. To remove a line from the graph, click on the line and select delete option.) CVP Graph Total Sales Revenue Fixed Expense Total Expense 4000 Volume in Units $200,000 $150,000 Dollars $100,000 $50,000 0 2000 6000 8000 Required: 1. Prepare a profit graph for the company up to a sales volume of 4,000 units. (Use the line tool to draw a single line (Profit). This line should only contain the two endpoints. Use the point tool (Break Even Point) to plot the Break Even Point. For your graph to grade correctly, you must enter the exact coordinates. Once all points have been plotted, click on the line (not individual points) and a tool icon will pop up. You can use this to enter exact co-ordinates for your points as needed. To remove a line/point from the graph, click on the line/point and select delete option.) Profit Graph Profit O $5,000 Break Even Point $0 $-5,000- $-10,000 $-15,000 $-20,000 TITT 0 500 1000 1500 2000 2500 3000 3500 4000 Sales Volume in Units
Step by Step Solution
There are 3 Steps involved in it

Get step-by-step solutions from verified subject matter experts