

Question: 1. When performing a DCF in M&A, what value is being calculated? How long is the forecast period, typically? What is the terminal value? How
1. When performing a DCF in M&A, what value is being calculated? How long is the forecast period, typically? What is the terminal value? How are each calculated?
2. Notice footnote 3 on working capital (dont include excess cash and interest-bearing liabilities like n/p)
3. What is the WACC?
4. How is the cost of debt estimated?
PLEASE HELP! Write short version
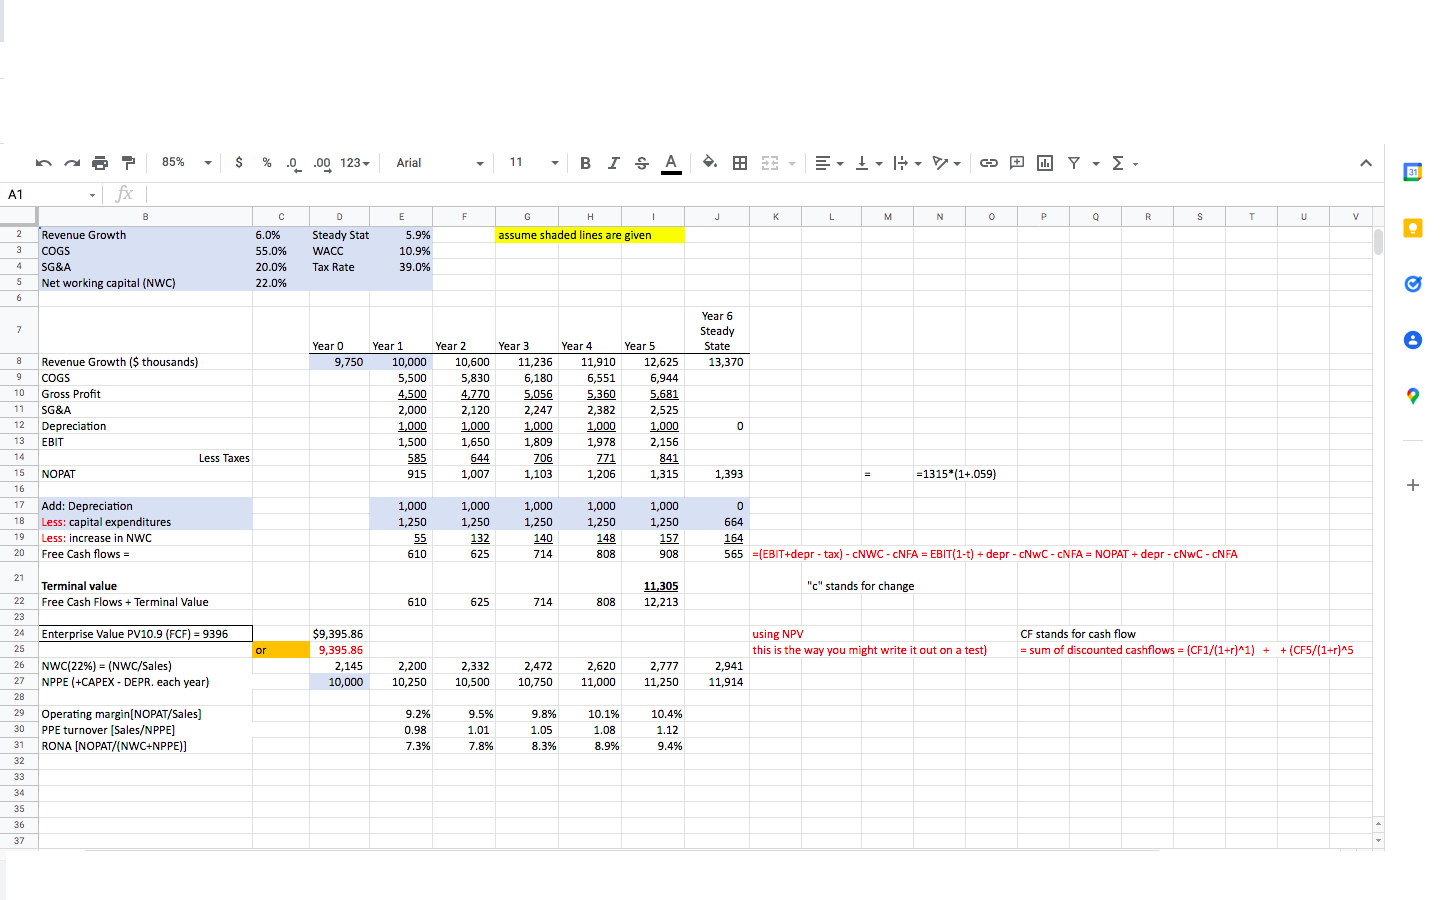
$ % 0 .00 123 .0 Arial 11 BISA - ' 1 G 1. , ^ 31 A1 F G H 1 J J L M na? 85% - fx B Revenue Growth COGS SG&A Net working capital (NWC) N O Q R S T U v 2 assume shaded lines are given 6.0% 55.0% 20.0% 22.0% D D Steady Stat WACC Tax Rate E 5.9% 10.9% 39.0% 3 4 5 6 7 Year 6 Steady State 13,370 Year o 9,750 8 9 10 11 Revenue Growth ($ thousands) COGS Gross Profit SG&A Depreciation EBIT Less Taxes NOPAT Year 1 10,000 5,500 4,500 2,000 1,000 1,500 585 915 Year 2 10,600 5,830 4,770 2,120 1,000 1,650 644 1,007 Year 3 11,236 6,180 5,056 2,247 1,000 1,809 706 1,103 Year 4 Year 5 11,910 12,625 6,551 6,944 5,360 5,681 2,382 2,525 1,000 1,000 1,978 2,156 771 841 1,206 1,315 0 12 13 14 1,393 =1315*(1+.059) 15 16 + 17 18 Add: Depreciation Less: capital expenditures Less: increase in NWC Free Cash flows = 1,000 1,250 55 610 1,000 1,250 132 625 1,000 1,250 140 714 1,000 1,250 148 808 1,000 1,250 157 908 0 o 664 164 565 =(EBIT+depr-tax) - CNWC-CNFA = EBIT(1-t) + depr - NWC-CNFA = NOPAT + depr - CNWC-CNFA 19 20 21 "c" stands for change Terminal value Free Cash Flows + Terminal Value 11,305 12,213 22 610 625 714 808 23 24 Enterprise Value PV10.9 (FCF) = 9396 using NPV this is the way you might write it out on a test) $9,395.86 9,395.86 2,145 10,000 CF stands for cash flow = sum of discounted cashflows = (CF1/(1+r)^1) + + (CF5/(1+r)^5 = ^ +^ or 25 26 27 28 NWC(22%) = (NWC/Sales) NPPE (+CAPEX - DEPR. each year) 2,200 10,250 2,332 10,500 2,472 10,750 2,620 11,000 2,777 11,250 2,941 11,914 29 30 Operating margin(NOPAT/Sales) PPE turnover (Sales/NPPE] RONA [NOPAT/(NWC+NPPE)] 9.2% 0.98 7.3% 9.5% 1.01 7.8% 9.8% 1.05 8.3% 10.1% 1.08 8.9% 10.4% 1.12 9.4% 31 32 33 34 35 36 37 $ % 0 .00 123 .0 Arial 11 BISA - ' 1 G 1. , ^ 31 A1 F G H 1 J J L M na? 85% - fx B Revenue Growth COGS SG&A Net working capital (NWC) N O Q R S T U v 2 assume shaded lines are given 6.0% 55.0% 20.0% 22.0% D D Steady Stat WACC Tax Rate E 5.9% 10.9% 39.0% 3 4 5 6 7 Year 6 Steady State 13,370 Year o 9,750 8 9 10 11 Revenue Growth ($ thousands) COGS Gross Profit SG&A Depreciation EBIT Less Taxes NOPAT Year 1 10,000 5,500 4,500 2,000 1,000 1,500 585 915 Year 2 10,600 5,830 4,770 2,120 1,000 1,650 644 1,007 Year 3 11,236 6,180 5,056 2,247 1,000 1,809 706 1,103 Year 4 Year 5 11,910 12,625 6,551 6,944 5,360 5,681 2,382 2,525 1,000 1,000 1,978 2,156 771 841 1,206 1,315 0 12 13 14 1,393 =1315*(1+.059) 15 16 + 17 18 Add: Depreciation Less: capital expenditures Less: increase in NWC Free Cash flows = 1,000 1,250 55 610 1,000 1,250 132 625 1,000 1,250 140 714 1,000 1,250 148 808 1,000 1,250 157 908 0 o 664 164 565 =(EBIT+depr-tax) - CNWC-CNFA = EBIT(1-t) + depr - NWC-CNFA = NOPAT + depr - CNWC-CNFA 19 20 21 "c" stands for change Terminal value Free Cash Flows + Terminal Value 11,305 12,213 22 610 625 714 808 23 24 Enterprise Value PV10.9 (FCF) = 9396 using NPV this is the way you might write it out on a test) $9,395.86 9,395.86 2,145 10,000 CF stands for cash flow = sum of discounted cashflows = (CF1/(1+r)^1) + + (CF5/(1+r)^5 = ^ +^ or 25 26 27 28 NWC(22%) = (NWC/Sales) NPPE (+CAPEX - DEPR. each year) 2,200 10,250 2,332 10,500 2,472 10,750 2,620 11,000 2,777 11,250 2,941 11,914 29 30 Operating margin(NOPAT/Sales) PPE turnover (Sales/NPPE] RONA [NOPAT/(NWC+NPPE)] 9.2% 0.98 7.3% 9.5% 1.01 7.8% 9.8% 1.05 8.3% 10.1% 1.08 8.9% 10.4% 1.12 9.4% 31 32 33 34 35 36 37
Step by Step Solution
There are 3 Steps involved in it

Get step-by-step solutions from verified subject matter experts