

Question: 1. Which company has the highest average gross margin to sales percentage and which company has the lowest average net income to sales percentage? a.
1. Which company has the highest average gross margin to sales percentage and which company has the lowest average net income to sales percentage?
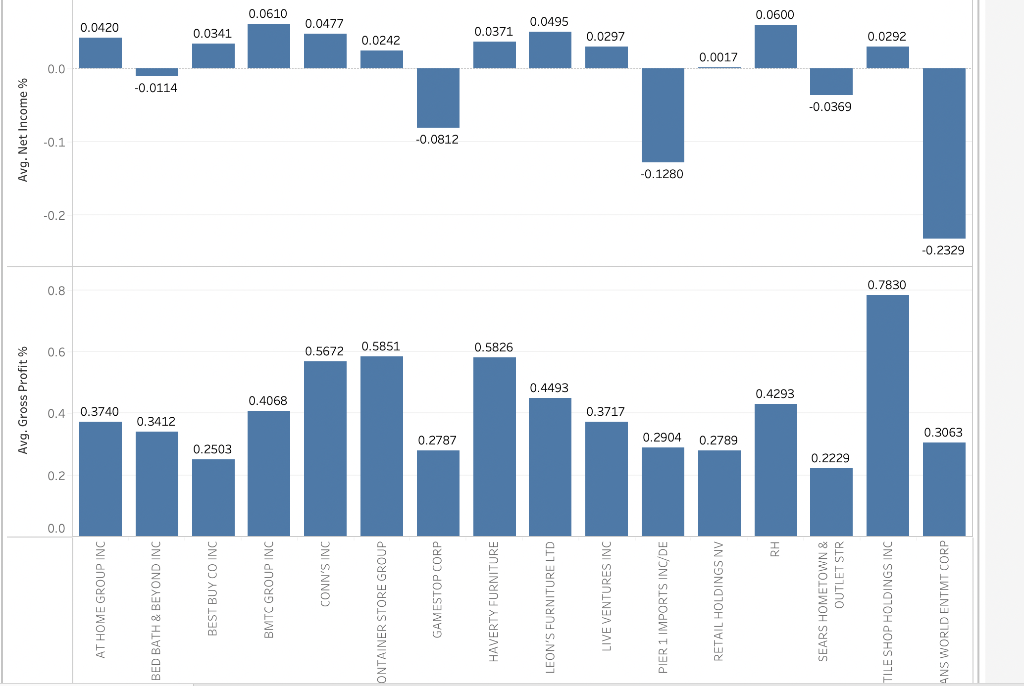
a. Tile Shop Holdings and Trans World Entertainment
b. Tile Shop Holdings and Pier 1 Imports
c. BMTC Group and Sears Hometown & Outlet
d. BMTC Group and Best Buy
2. By hovering the over the figures, which company has the highest average cost of goods sold to sales percentage?
a. Sears Hometown & Outlet
b.Gamestop
c.Best Buy
d. Tile Shop Holdings
3. Which of the following income statement item can be used to explain the difference in average gross margin to sales percentage and average net income to sales percentage?
a.Dividend
b.Sales returns
c.Cost of goods sold
d.General and administrative expenses
4. Gross profit to sales percentage is often used as an indicator to show whether a specific industry or company is more towards labor intensive (lower gross profit to sales ratio) or more towards knowledge-intensive (higher gross profit to sales ratio). If this is the case, would we consider these companies all in the same industry?
5. When you look at the visualization, you notice that some companies have a significant drop from the average gross profit to sales percentage to the average net income to sales percentage while others do not though their average gross profit to sales ratios are not too high. How can we explain these differences?
Avg. Gross Profit % Avg. Net Income % 0.8 9 AT HOME GROUP INC 0.3740 0.0420 BED BATH & BEYOND INC CIVO -0.0114 BEST BUY CO INC 0.0341 BMTC GROUP INC 0.4068 0.0610 CONN'S INC 0.0477 illo 0.5672 0.5851 ONTAINER STORE GROUP 0.0242 GAMESTOP CORP 0.2787 -0.0812 HAVERTY FURNITURE 0.5826 0.0371 0.0495 LEON'S FURNITURE LTD 0.4493 LIVE VENTURES INC 0.3717 0.0297 PIER 1 IMPORTS INC/DE -0.1280 0.2904 0.2789 RETAIL HOLDINGS NV Z1000 RH 0.4293 0.0600 SEARS HOMETOWN & OUTLET STR 0.2229 -0.0369 TILE SHOP HOLDINGS INC 0.7830 0.0292 ANS WORLD ENTMT CORP 0.3063 -0.2329
Step by Step Solution
There are 3 Steps involved in it

Get step-by-step solutions from verified subject matter experts