

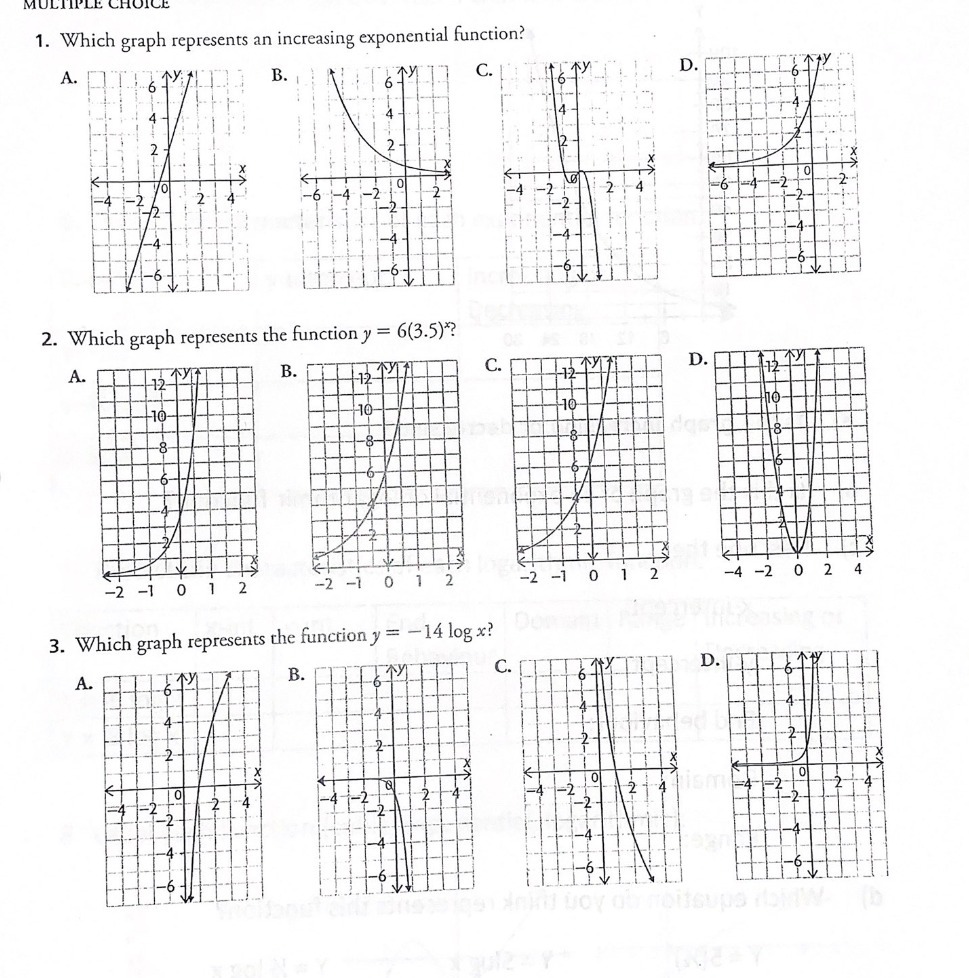
Question: 1. Which graph represents an increasing exponential function? A. B. C. D. 2. Which graph represents the function y = 6(3.5)*? A. B. C. 10-
Step by Step Solution
There are 3 Steps involved in it
1 Expert Approved Answer
Step: 1 Unlock

Question Has Been Solved by an Expert!
Get step-by-step solutions from verified subject matter experts
Step: 2 Unlock
Step: 3 Unlock