

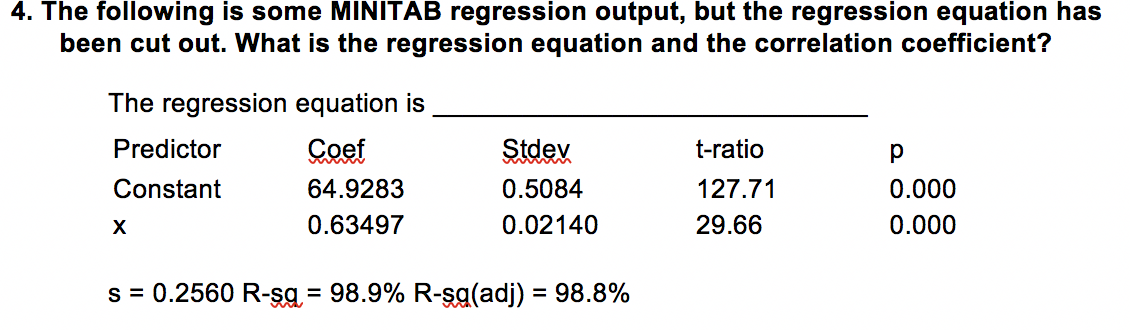
Question: 1. Which of the following statements best describes the scatterplot pictured? I.A linear model appears to be a good fit. II.The variables are positively associated.
1. Which of the following statements best describes the scatterplot pictured?
I.A linear model appears to be a good fit.
II.The variables are positively associated.
III.The variables are negatively associated
A.I only
B.II only
C.III only
D.I and II only
E.II and III only
2. Given a set of ordered pairs (x, y) such that sx = 3.2, sy = 1.3, r = ?.74, find the slope
of the regression line of y on x.
A. -1.82
B. -3.08
C. -.301
D. 1.82
E. .301
3. A set of y-values is transformed (in order to yield a better linear fit) by taking the natural logarithm of each value. The regression of ln y on x is then computed as ln y = -3.1 + 2.5x. What is the predicted value of y when x = 3?
A.81.5
B.4.4
C.25118.9
D.-1.8
E..17
4. The following is some MINITAB regression output, but the regression equation has been cut out. What is the regression equation and the correlation coefficient?
The regression equation is _____________________________
Predictor
Coef
Stdev
t-ratio
p
Constant
64.9283
0.5084
127.71
0.000
x
0.63497
0.02140
29.66
0.000
s = 0.2560 R-sq = 98.9% R-sq(adj) = 98.8%
A.y = .2560 + 64.93x, r = .989
B.y = 64.93 + .2560x, r = -.994
C.y = 64.93 + .63x, r = .989
D.y = .63 + 64.93x, r = -.994
E.y = 64.93 + .63x, r = .994
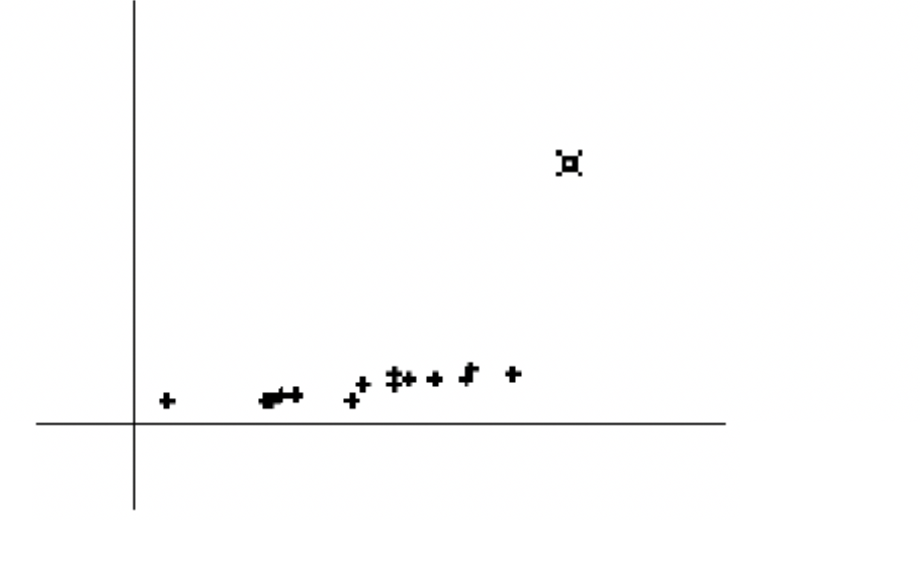
4. The following is some MlNlTAB regression output, but the regression equation has been cut out. What is the regression equation and the correlation coefficient? The regression equation is Predictor 9932: m t-ratio p Constant 64.9283 0.5084 127.71 0.000 x 0.63497 0.02140 29.66 0.000 s = 0.2560 R-sg; 98.9% R-Q(adj) = 98.8% \f\f\f\f
Step by Step Solution
There are 3 Steps involved in it

Get step-by-step solutions from verified subject matter experts