

Question: 1. which variable has the strongest correlation with total operating cost? a-2. what is the correlation? b-1. which variable has the weakest correlation with total
1. which variable has the strongest correlation with total operating cost?
a-2. what is the correlation?
b-1. which variable has the weakest correlation with total operating cost?
b-2. what is the correlation?
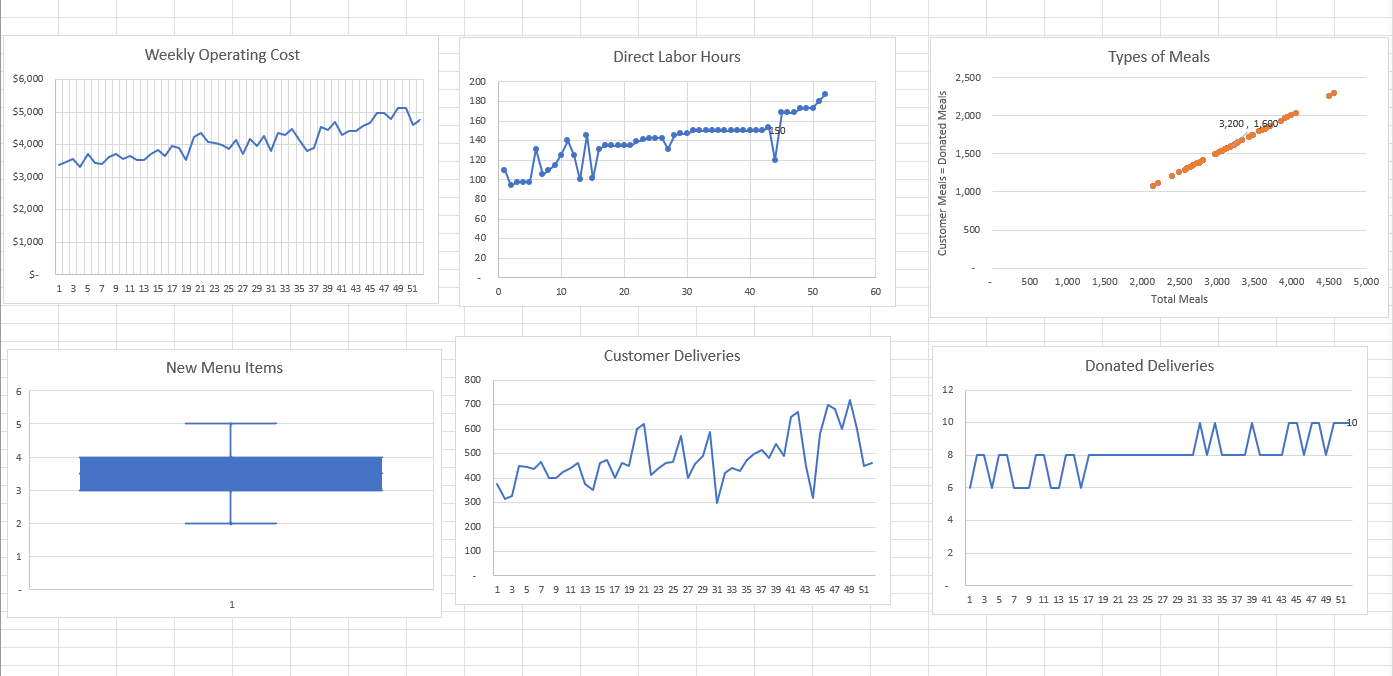
c. does it make sense to analyze the total number of meals produced, the number of meals sold, and the number of meals donated as separate variables?
3.
a. what is the estimate of weekly fixed cost?
b. what is the estimate of variable cost per unit of x?
c. what percentage of the variation in operating cost can be explained by the single best cost driver?
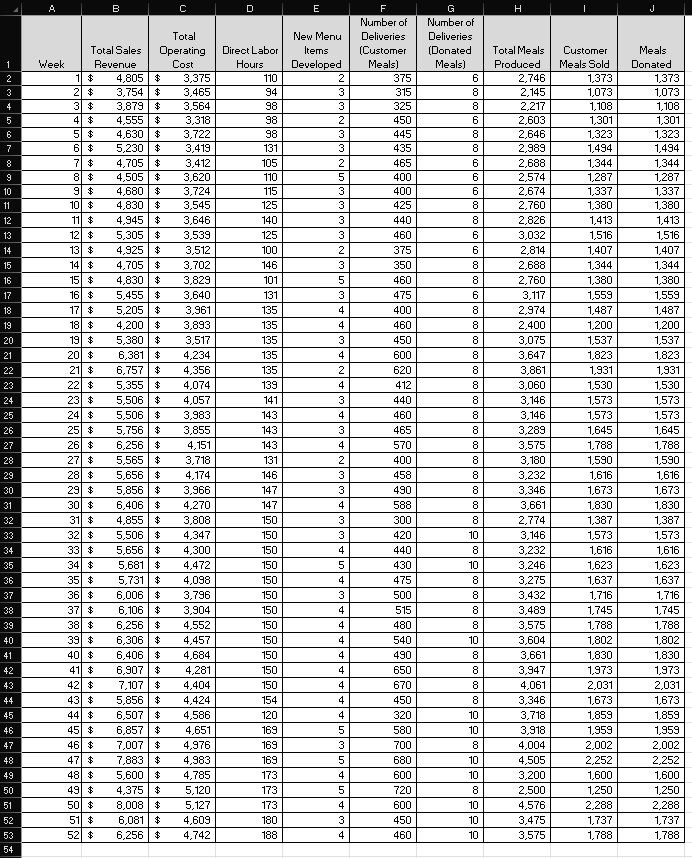
1 2 3 4 5 6 7 9 10 11 12 13 14 15 16 17 18 19 20 21 22 23 24 25 26 27 28 29 30 31 32 33 34 35 36 37 38 39 40 41 42 43 44 45 46 47 48 49 50 51 52 53 54 A Week Total Sales Revenue 1 $ 2 $ 3 $ 4 $ 5 $ 6 $ 7 $ 8 $ 9 $ 10 $ 11 $ 12 $ 13 $ 14 $ 15 $ 16 $ 17 $ 18 $ 19 $ 20 $ 21 $ 22 $ 23 $ 24 $ 25 $ 26 $ 27 $ 28 $ 29 $ 30 $ 31 $ 32 $ 33 $ 34 $ 35 $ 36 $ 37 $ 38 $ 39 $ 40 $ 41 $ 42 $ 43 $ 44 $ 45 $ 46 $ 47 $ 48 $ B 49 $ 50 $ 51 $ 52 $ Total Operating Cost 4,805 $ 3,754 $ 3,879 $ 4,555 $ 3,375 3,465 3,564 3,318 4,630 $ 3,722 5,230 $ 3,419 4,705 $ 3,412 4,505 $ 3,620 4,680 $ 3,724 4,830 $ 3,545 4,945 $ 3,646 5,305 $ 3,539 4,925 $ 3,512 4,705 $ 3,702 4,830 $ 3,829 5,455 $ 3,640 5,205 $ 4,200 $ 5,380 $ 6,381 $ 6,757 $ 5,355 $ 5,506 $ 5,506 $ 5,756 $ 6,256 $ 5,565 $ 5,656 $ 7,007 $ 7,883 $ 5,600 $ 5,856 $ 6,406 $ 4,855 $ 5,506 $ 5,656 $ 5,681 $ 4,472 5,731 $ 6,006 $ 6,106 $ 6,256 $ 6,306 $ 6,406 $ 6,907 $ 7,107 $ 5,856 $ 6,507 $ 6,857 $ 4,375 $ 8,008 $ 6,081 $ 6,256 $ 3,961 3,893 3,517 4,234 4,356 4,074 4,057 3,983 3,855 4,151 3,718 4,174 3,966 4,270 3,808 4,347 4,300 4,098 3,796 3,904 4,552 4,457 4,684 4,281 4,404 4,424 4,586 4,651 4,976 4,983 4,785 5,120 5,127 4,609 4,742 D Direct Labor Hours 110 94 98 98 98 131 105 110 115 125 140 125 100 146 101 131 135 135 135 135 135 139 141 143 143 143 131 146 147 147 150 150 150 150 150 150 150 150 150 150 150 150 154 120 169 169 169 173 173 173 180 188 E New Menu Items Developed 2 3 3 2 3 3 2 5 3 3 3 3 2 3 5 3 4 4 3 4 2 4 3 4 3 4 2 3 3 4 3 3 4 5 4 3 4 4 4 4 4 4 4 4 5 3 5 4 5 4 3 4 F Number of Deliveries (Customer Meals) 375 315 325 450 445 435 465 400 400 425 440 460 375 350 460 475 400 460 450 600 620 412 440 460 465 570 400 458 490 588 300 420 440 430 475 500 515 480 540 490 650 670 450 320 580 700 680 600 720 600 450 460 G Number of Deliveries (Donated Meals) 6 8 8 6 8 8 6 6 6 8 8 6 6 8 8 6 8 8 8 8 8 8 8 8 8 8 8 8 8 8 8 10 8 10 8 8 8 8 10 8 8 8 8 10 10 8 10 10 8 10 Tele 10 10 H Total Meals Produced 2,746 2,145 2,217 2,603 2,646 2,989 2,688 2,574 2,674 2,760 2,826 3,032 2,814 2,688 2,760 3,117 2,974 2,400 3,075 3,647 3,861 3,060 3,146 3,146 3,289 3,575 3,180 3,232 3,346 3,661 2,774 3,146 3,232 3,246 3,275 3,432 3,489 3,575 3,604 3,661 3,947 4,061 3,346 3,718 3,918 4,004 4,505 3,200 2,500 4,576 3,475 3,575 Customer Meals Sold 1,373 1,073 1,108 1,301 1,323 1,494 1,344 1,287 1,337 1,380 1,413 1,516 1,407 1,344 1,380 1,559 1,487 1,200 1,537 1,823 1,931 1,530 1,573 1,573 1,645 1,788 1,590 1,616 1,673 1,830 1,387 1,573 1,616 1,623 1,637 1,716 1,745 1,788 1,802 1,830 1,973 2,031 1,673 1,859 1,959 2,002 2,252 1,600 1,250 2,288 1,737 1,788 J Meals Donated 1,373 1,073 1,108 1,301 1,323 1,494 1,344 1,287 1,337 1,380 1,413 1,516 1,407 1,344 1,380 1,559 1,487 1,200 1,537 1,823 1,931 1,530 1,573 1,573 1,645 1,788 1,590 1,616 1,673 1,830 1,387 1,573 1,616 1,623 1,637 1,716 1,745 1,788 1,802 1,830 1,973 2,031 1,673 1,859 1,959 2,002 2,252 1,600 1,250 2,288 1,737 1,788
Step by Step Solution
3.42 Rating (149 Votes )
There are 3 Steps involved in it
ANSWER 1 a2 The variable with the strongest correlation with total operating cost is ... View full answer

Get step-by-step solutions from verified subject matter experts