

Question: 1, Why are breakeven sales dollars different when considering the weighted average contribution margin for the sales mix than when the average contribution margin (without
1, Why are breakeven sales dollars different when considering the weighted average contribution margin for the sales mix than when the average contribution margin (without considering the sales mix) is used?
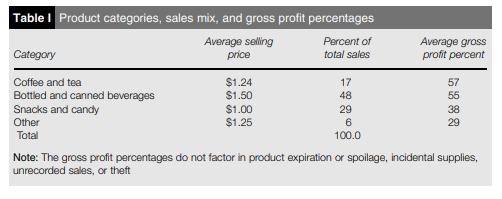
2. What costs are not captured in the calculation? Hint: see Table I and Operations and Internal Controls above.
| Table IV: Cost of goods sold and gross profit analysis by semester | |||||||
| Fall 2009 | Spring 2010 | Fall 2010 | Spring 2011 | Fall 2011 | Spring 2012 | Fall 2012 | |
| Net Sales | $3,136.48 | $3,250.97 | $3,292.65 | $2,122.63 | $2,582.67 | $2,094.95 | $2,099.73 |
| Cost of sales | |||||||
| Beg. inventory | 106.09 | 423.07 | 142.36 | 85.80 | 425.68 | 579.64 | 398.77 |
| Add: purchases | 2,191.27 | 1,479.72 | 1,648.76 | 2,136.31 | 1,524.15 | 1,104.73 | 1,264.48 |
| Available for sale | 2,297.36 | 1,902.79 | 1,791.12 | 2,222.11 | 1,949.83 | 1,684.37 | 1,663.25 |
| Less: ending inventory | 423.07 | 142.36 | 85.80 | 425.68 | 579.64 | 398.77 | 387.85 |
| Cost of goods sold | $1,874.29 | $1,760.43 | $1,705.32 | $1,796.43 | $1,370.19 | $1,285.60 | $1,275.40 |
| Gross profit | $1,262.19 | $1,490.54 | $1587.33 | $326.20 | $1212.48 | $809.35 | $824.33 |
Table I Product categories, sales mix, and gross profit percentages Average selling price Percent of Average gross profit percent Category total sales Coffee and tea $1.24 $1.50 17 57 Bottled and canned beverages Snacks and candy Other 48 55 $1.00 $1.25 29 38 29 Total 100.0 Note: The gross profit percentages do not factor in product expiration or spoilage, incidental supplies, unrecorded sales, or theft
Step by Step Solution
3.42 Rating (165 Votes )
There are 3 Steps involved in it
1 breakeven sales dollars different when considering the weighted average contribution margin ... View full answer

Get step-by-step solutions from verified subject matter experts