

Question: 1. With reference to W4 - Beta, provide the interpretations of the regression output, specifically the levels of Coefficients and significance (p-values) of the Intercept
1. With reference to W4 - Beta, provide the interpretations of the regression output, specifically the levels of Coefficients and significance (p-values) of the Intercept and Beta (X Variable 1) in W4-Beta.
[Note] If the p-value is less than 0.05 (0.01), then it is significant at the 5% (1%) level. The null hypothesis is that the coefficient is equal to zero.
2. With reference to W4 - Beta, are the regression results consistent with the CAPM predictions? Explain. And If the results are inconsistent, also explain the potential reason(s)
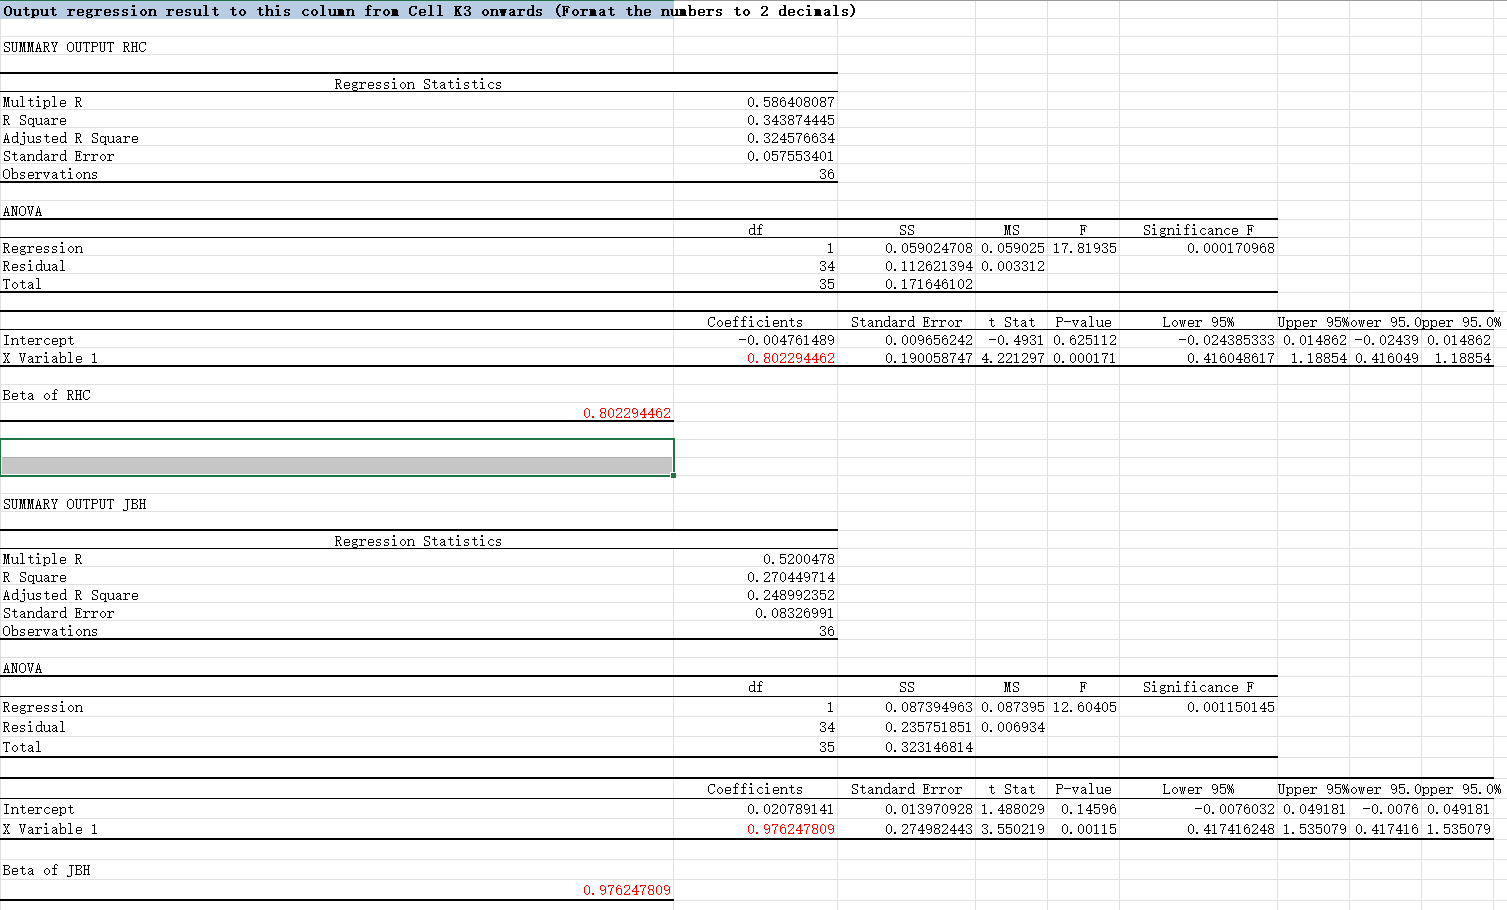
Output regression result to this colun froi Cell K3 onyards (Fornat the numbers to 2 decinals) SUMMARY OUTPUT RHC Regression Statistics Multiple R R Square Adjusted R Square Standard Error Observations 0.586408087 0.343874445 0.324576634 0.057553401 36 ANOVA df Significance F 0.000170968 Regression Residual Total 1 34 35 SS MS F 0.059024708 0.059025 17. 81935 0.112621394 0.003312 0.171646102 Intercept X Variable 1 Coefficients -0.004761489 0.802294462 Standard Error t Stat P-value 0.009656242 -0.4931 0.625112 0.190058747 4. 221297 0.000171 Lower 95% Upper 95%ower 95. Opper 95.0% -0.024385333 0.014862 -0.02439 0.014862 0. 416048617 1. 18854 0. 416049 1.18854 Beta of RHC 0.802294462 SUMMARY OUTPUT JBH Regression Statistics Multiple R R Square Adjusted R Square Standard Error Observations 0.5200478 0.270449714 0.248992352 0.08326991 36 ANOVA df Significance F 0.001150145 Regression Residual Total 1 34 35 SS MS F 0.087394963 0.087395 12. 60405 0.235751851 0.006934 0.3231 46814 Intercept X Variable 1 Coefficients 0.020789141 0.976247809 Standard Error t Stat P-value 0.013970928 1. 488029 0.14596 0.274982443 3. 550219 0.00115 Lower 95% Upper 95%ower 95. Opper 95.0% -0.0076032 0.049181 -0.0076 0.049181 0.417416248 1.535079 0.417416 1.535079 Beta of JBH 0.976247809 Output regression result to this colun froi Cell K3 onyards (Fornat the numbers to 2 decinals) SUMMARY OUTPUT RHC Regression Statistics Multiple R R Square Adjusted R Square Standard Error Observations 0.586408087 0.343874445 0.324576634 0.057553401 36 ANOVA df Significance F 0.000170968 Regression Residual Total 1 34 35 SS MS F 0.059024708 0.059025 17. 81935 0.112621394 0.003312 0.171646102 Intercept X Variable 1 Coefficients -0.004761489 0.802294462 Standard Error t Stat P-value 0.009656242 -0.4931 0.625112 0.190058747 4. 221297 0.000171 Lower 95% Upper 95%ower 95. Opper 95.0% -0.024385333 0.014862 -0.02439 0.014862 0. 416048617 1. 18854 0. 416049 1.18854 Beta of RHC 0.802294462 SUMMARY OUTPUT JBH Regression Statistics Multiple R R Square Adjusted R Square Standard Error Observations 0.5200478 0.270449714 0.248992352 0.08326991 36 ANOVA df Significance F 0.001150145 Regression Residual Total 1 34 35 SS MS F 0.087394963 0.087395 12. 60405 0.235751851 0.006934 0.3231 46814 Intercept X Variable 1 Coefficients 0.020789141 0.976247809 Standard Error t Stat P-value 0.013970928 1. 488029 0.14596 0.274982443 3. 550219 0.00115 Lower 95% Upper 95%ower 95. Opper 95.0% -0.0076032 0.049181 -0.0076 0.049181 0.417416248 1.535079 0.417416 1.535079 Beta of JBH 0.976247809
Step by Step Solution
There are 3 Steps involved in it

Get step-by-step solutions from verified subject matter experts