

Question: 1. Working Capital 1,552,000 2. Current ratio 2.7 3. Quick ratio 4. Accounts receivable turnover 20.0 5. Number of days' sales in receivables 6. Inventory
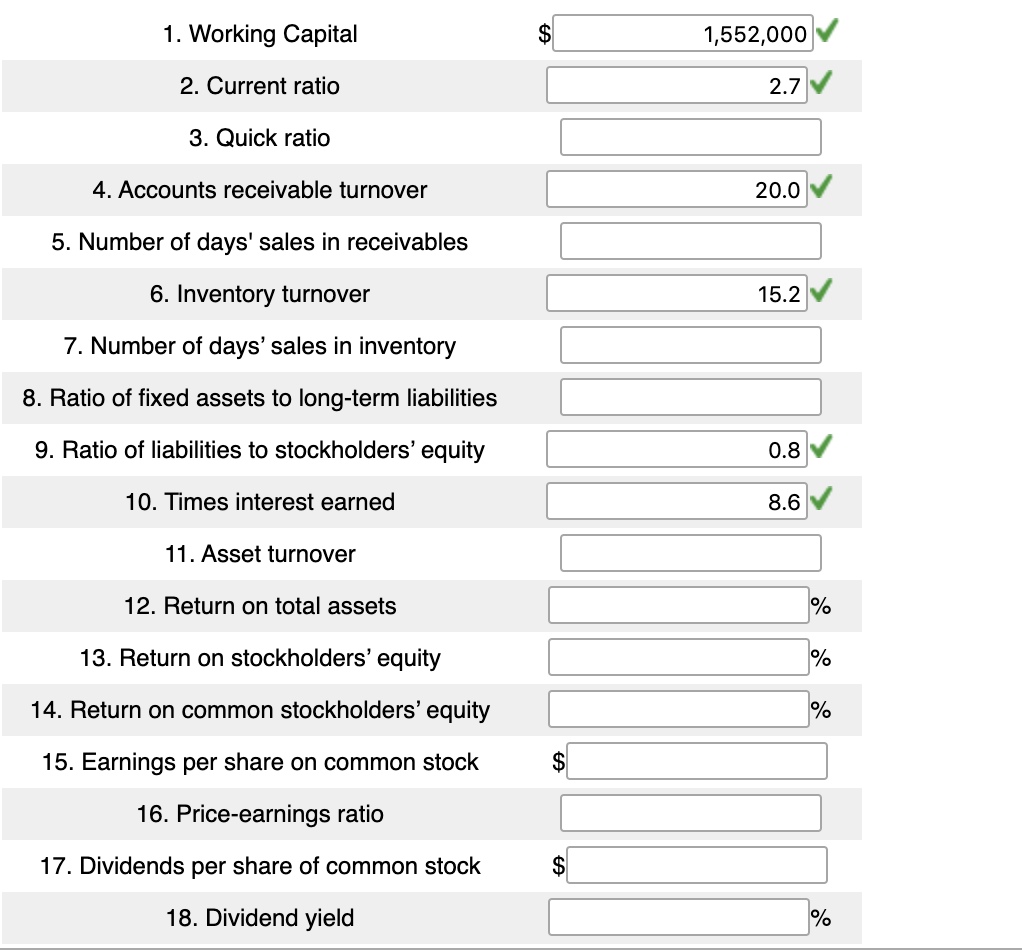
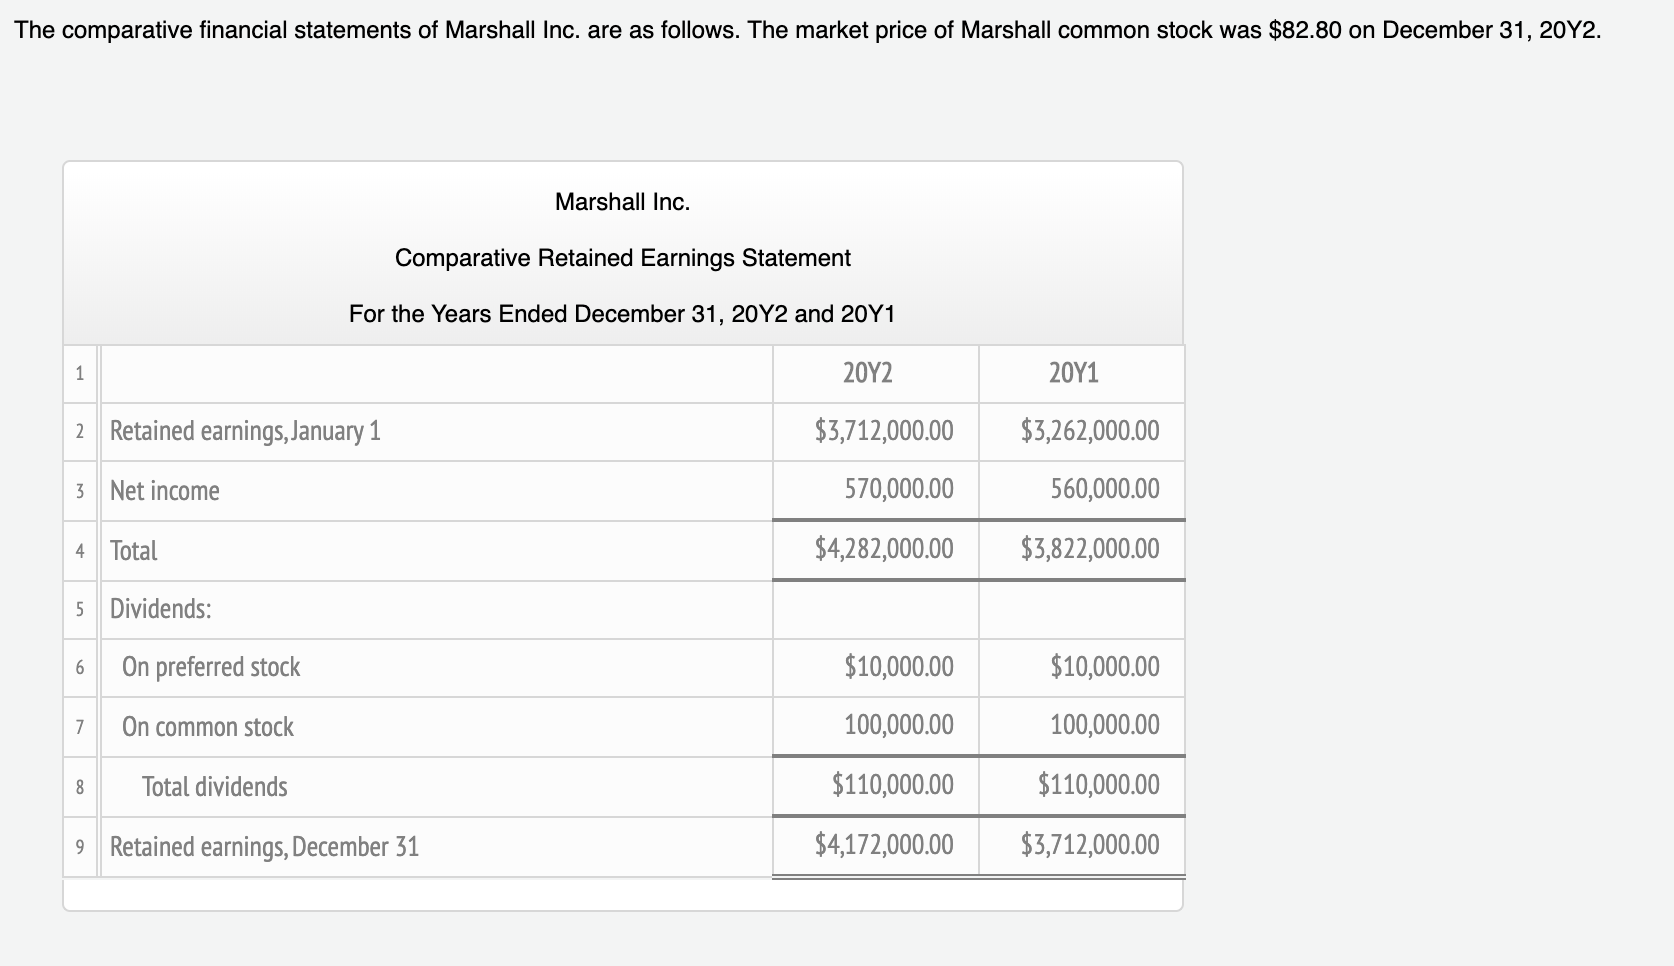
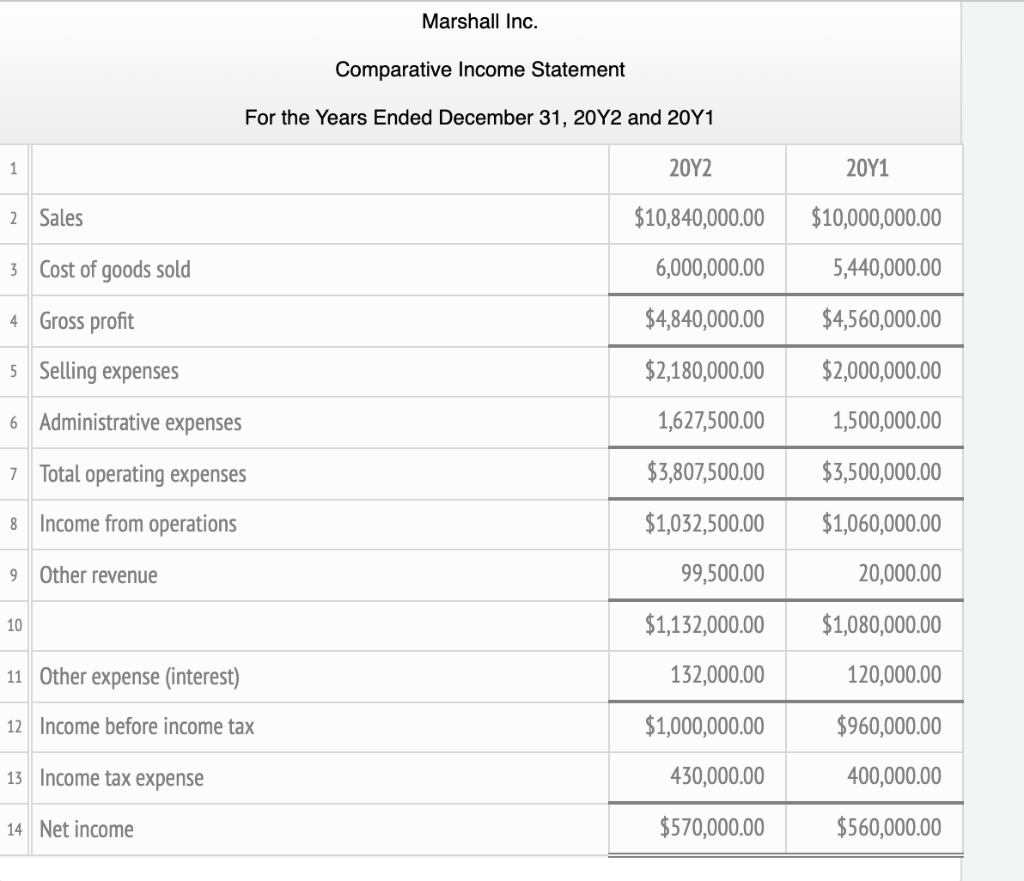
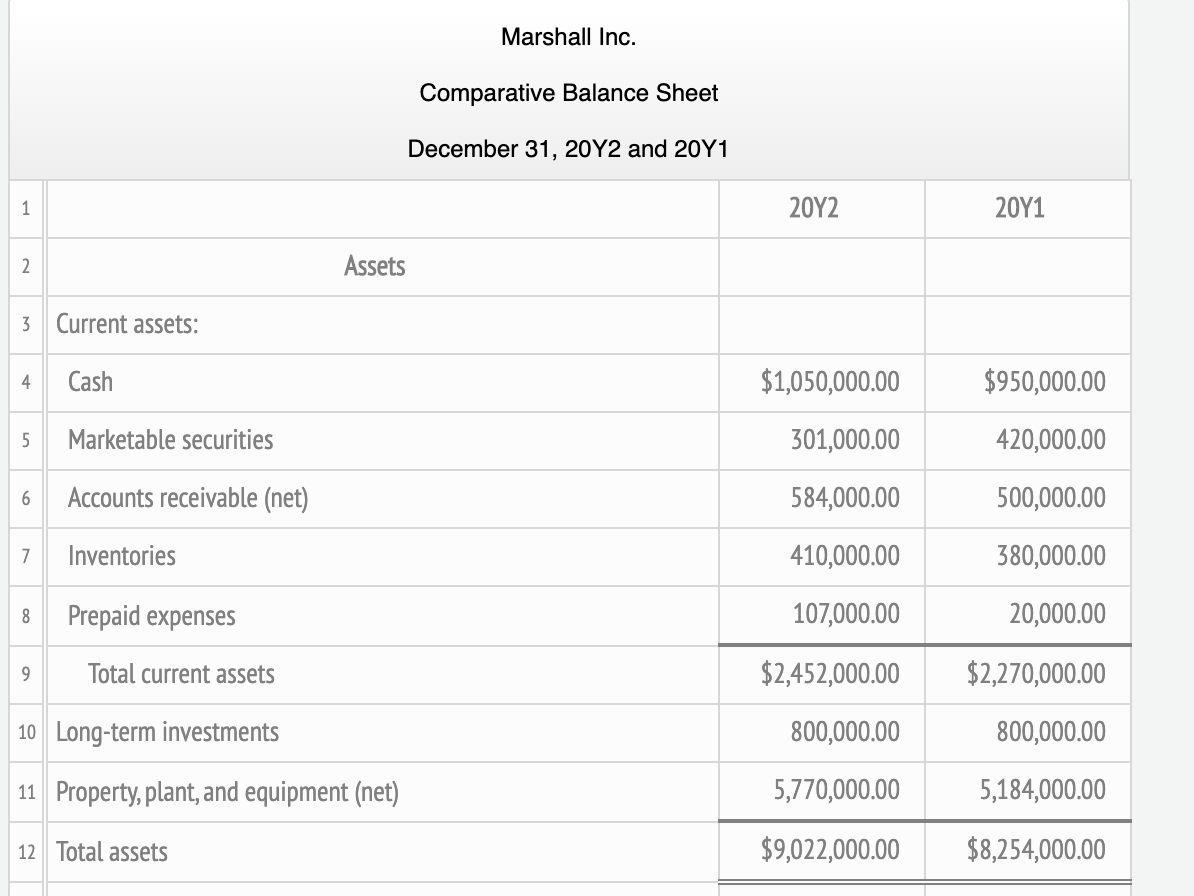
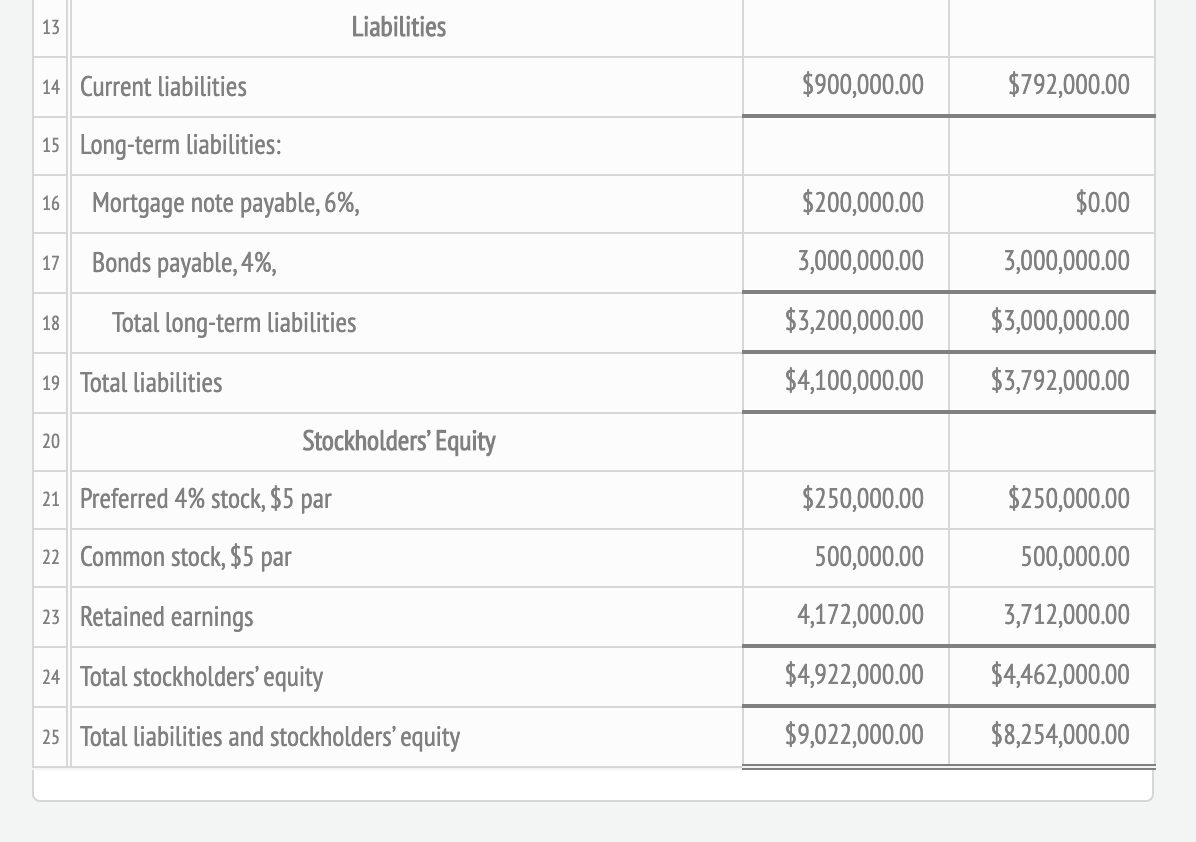
1. Working Capital 1,552,000 2. Current ratio 2.7 3. Quick ratio 4. Accounts receivable turnover 20.0 5. Number of days' sales in receivables 6. Inventory turnover 15.2 7. Number of days' sales in inventory 8. Ratio of fixed assets to long-term liabilities 9. Ratio of liabilities to stockholders' equity 0.8 10. Times interest earned 8.6 11. Asset turnover 12. Return on total assets % 13. Return on stockholders' equity 14. Return on common stockholders' equity % 15. Earnings per share on common stock $ 16. Price-earnings ratio 17. Dividends per share of common stock 18. Dividend yield % The comparative financial statements of Marshall Inc. are as follows. The market price of Marshall common stock was $82.80 on December 31, 20Y2 Marshall Inc. Comparative Retained Earnings Statement For the Years Ended December 31, 20Y2 and 20Y1 202 20Y1 1 Retained earnings,January 1 $3,712,000.00 $3,262,000.00 2 570,000.00 560,000.00 3 Net income $4,282,000.00 $3,822,000.00 4 Total 5 Dividends: $10,000.00 $10,000.00 On preferred stock 6 100,000.00 100,000.00 On common stock 7 $110,000.00 $110,000.00 Total dividends 8 $4,172,000.00 $3,712,000.00 Retained earnings, December 31 9 Marshall Inc. Comparative Income Statement For the Years Ended December 31, 20Y2 and 20Y1 202 201 1 $10,840,000.00 $10,000,000.00 Sales 2 6,000,000.00 5,440,000.00 Cost of goods sold 3 $4,560,000.00 $4,840,000.00 4 Gross profit $2,000,000.00 $2,180,000.00 Selling expenses 5 6 Administrative expenses 1,627,500.00 1,500,000.00 $3,807,500.00 $3,500,000.00 Total operating expenses 7 $1,032,500.00 $1,060,000.00 Income from operations 8 99,500.00 20,000.00 Other revenue $1,132,000.00 $1,080,000.00 10 0ther expense (interest) 132,000.00 120,000.00 11 $1,000,000.00 $960,000.00 12 Income before income tax 430,000.00 400,000.00 Income tax expense. 13 $570,000.00 $560,000.00 14 Net income Marshall Inc Comparative Balance Sheet December 31, 20Y2 and 20Y1 20Y2 201 1 Assets 2 2 3Current assets: $1,050,000.00 $950,000.00 Cash 4 Marketable securities 301,000.00 420,000.00 5 Accounts receivable (net) 500,000.00 584,000.00 6 380,000.00 Inventories 410,000.00 7 107,000.00 Prepaid expenses 20,000.00 $2,452,000.00 $2,270,000.00 Total current assets 9 800,000.00 10 Long-term investments 800,000.00 5,184,000.00 5,770,000.00 Property, plant, and equipment (net) 11 $9,022,000.00 $8,254,000.00 12 Total assets Liabilities 13 $900,000.00 $792,000.00 14 Current liabilities 15 Long-term liabilities: $200,000.00 $0.00 Mortgage note payable, 6%, 16 3,000,000.00 Bonds payable, 4%, 3,000,000.00 $3,200,000.00 $3,000,000.00 Total long-term liabilities 18 $4,100,000.00 $3,792,000.00 19 Total liabilities Stockholders' Equity 20 Preferred 4% stock, $5 par $250,000.00 $250,000.00 21 22 Common stock, $5 par 500,000.00 500,000.00 23 Retained earnings 4,172,000.00 3,712,000.00 $4,922,000.00 $4,462,000.00 Total stockholders' equity 24 $9,022,000.00 $8,254,000.00 Total liabilities and stockholders' equity 25 17
Step by Step Solution
There are 3 Steps involved in it

Get step-by-step solutions from verified subject matter experts