

Question: 1. Write a function that describes this graph. 5. Assume you have collected data pairs (x,y) on a certain variety of tree. x is the
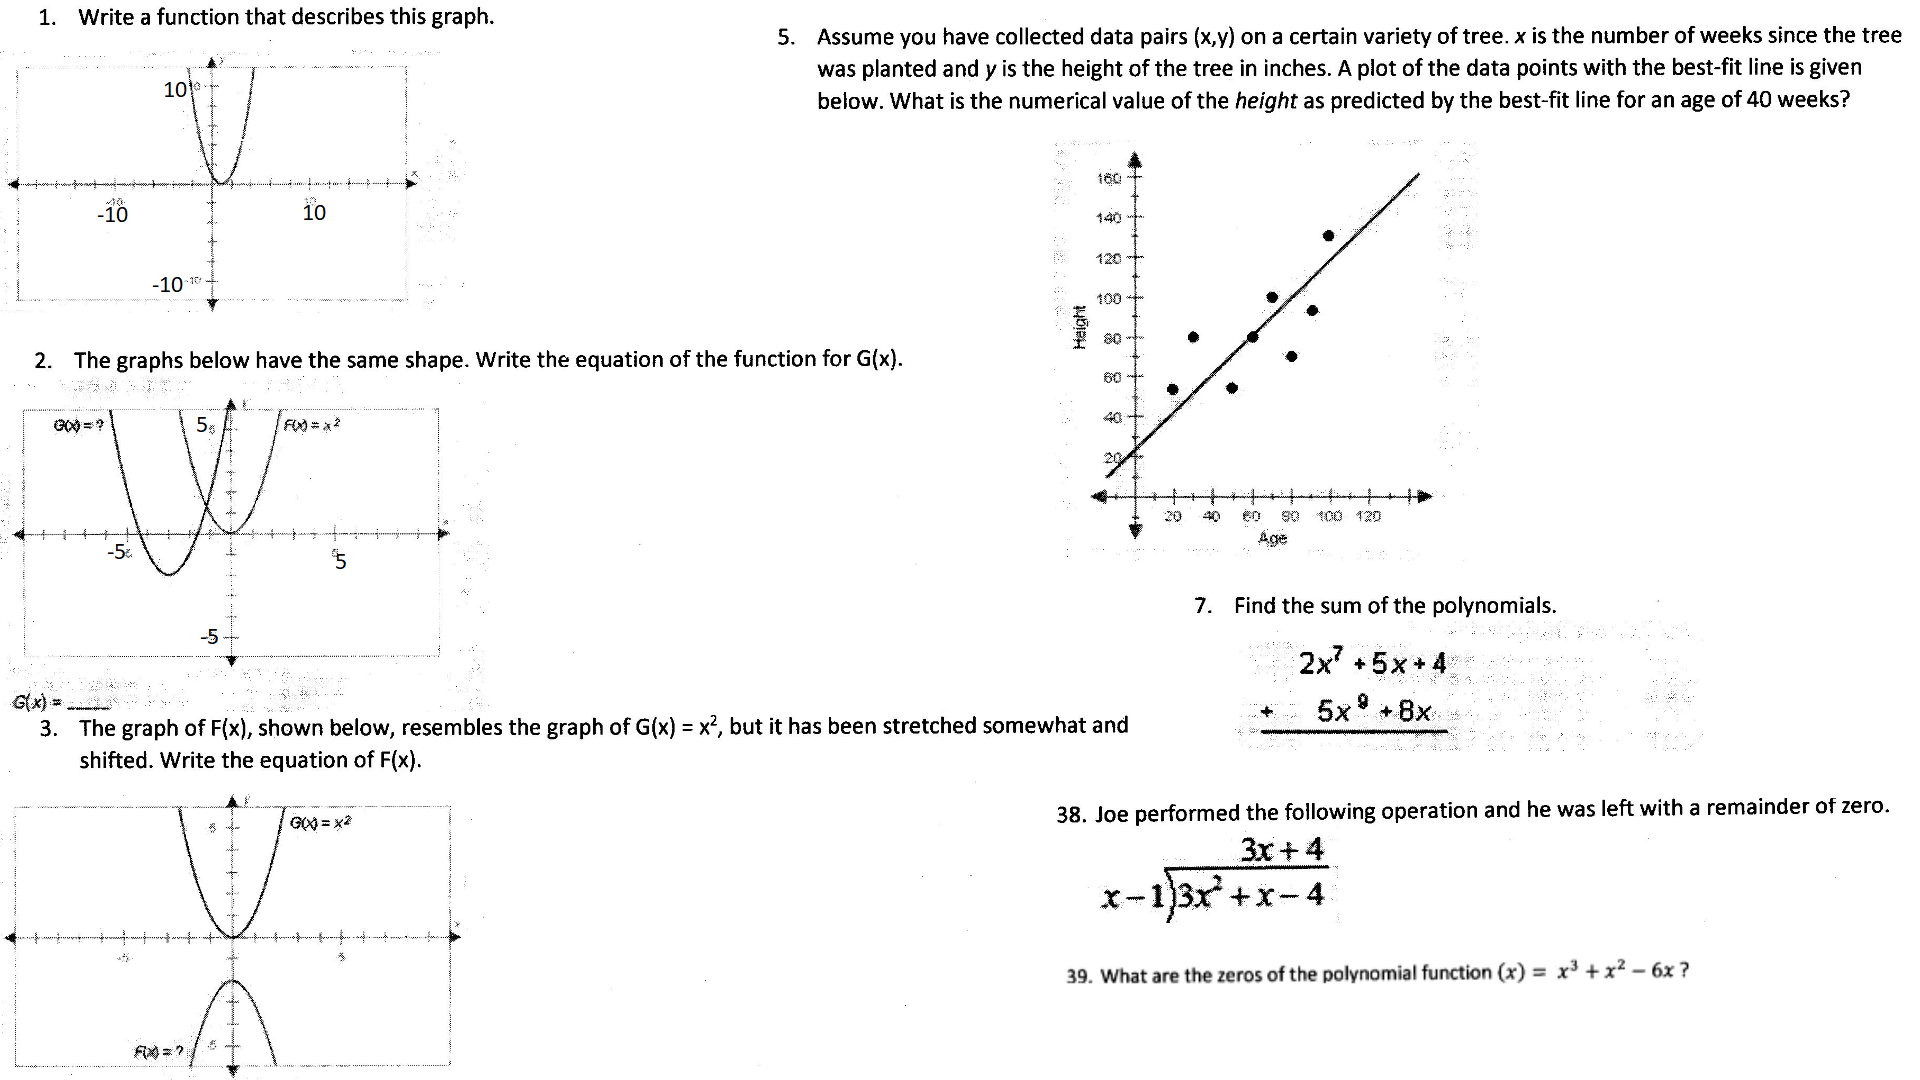
1. Write a function that describes this graph. 5. Assume you have collected data pairs (x,y) on a certain variety of tree. x is the number of weeks since the tree was planted and y is the height of the tree in inches. A plot of the data points with the best-fit line is given below. What is the numerical value of the height as predicted by the best-fit line for an age of 40 weeks? 180 -10 10 120- -10-10 100 Heigh 80 - 2. The graphs below have the same shape. Write the equation of the function for G(x). 300 =? 20 20 40 60 90 100 120 Age 7. Find the sum of the polynomials. -5 2x + 5x+4 G(x) = 3. The graph of F(x), shown below, resembles the graph of G(x) = x2, but it has been stretched somewhat and 5x * + 8x shifted. Write the equation of F(x). G() = x2 38. Joe performed the following operation and he was left with a remainder of zero. 3x + 4 x-13x + x-4 39. What are the zeros of the polynomial function (x) = x3 + x2 - 6x
Step by Step Solution
There are 3 Steps involved in it

Get step-by-step solutions from verified subject matter experts