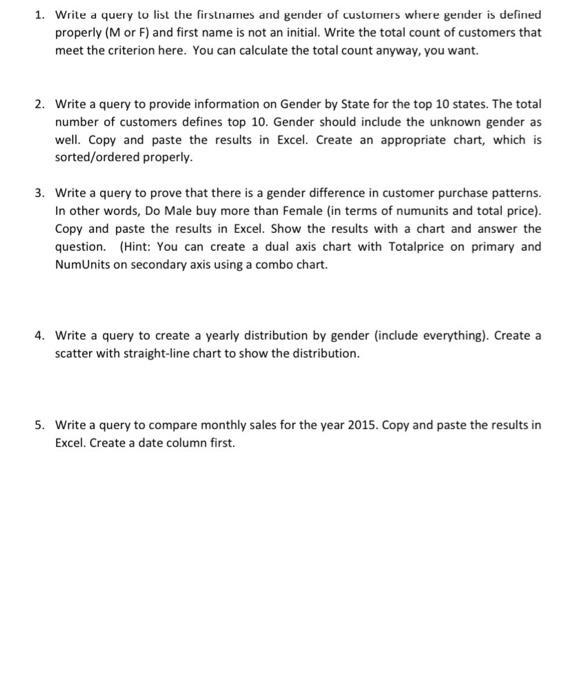
Question: 1. Write a query to list the firstnames and gender of customers where gender is defined properly (M or F) and first name is not

1. Write a query to list the firstnames and
1. Write a query to list the firstnames and gender of customers where gender is defined properly (M or F) and first name is not an initial. Write the total count of customers that meet the criterion here. You can calculate the total count anyway, you want. 2. Write a query to provide information on Gender by State for the top 10 states. The total number of customers defines top 10. Gender should include the unknown gender as well. Copy and paste the results in Excel. Create an appropriate chart, which is sorted/ordered properly. 3. Write a query to prove that there is a gender difference in customer purchase patterns. In other words, Do Male buy more than Female (in terms of numunits and total price). Copy and paste the results in Excel. Show the results with a chart and answer the question. (Hint: You can create a dual axis chart with Totalprice on primary and NumUnits on secondary axis using a combo chart. 4. Write a query to create a yearly distribution by gender (include everything). Create a scatter with straight-line chart to show the distribution. 5. Write a query to compare monthly sales for the year 2015. Copy and paste the results in Excel. Create a date column first. 1. Write a query to list the firstnames and gender of customers where gender is defined properly (M or F) and first name is not an initial. Write the total count of customers that meet the criterion here. You can calculate the total count anyway, you want. 2. Write a query to provide information on Gender by State for the top 10 states. The total number of customers defines top 10. Gender should include the unknown gender as well. Copy and paste the results in Excel. Create an appropriate chart, which is sorted/ordered properly. 3. Write a query to prove that there is a gender difference in customer purchase patterns. In other words, Do Male buy more than Female (in terms of numunits and total price). Copy and paste the results in Excel. Show the results with a chart and answer the question. (Hint: You can create a dual axis chart with Totalprice on primary and NumUnits on secondary axis using a combo chart. 4. Write a query to create a yearly distribution by gender (include everything). Create a scatter with straight-line chart to show the distribution. 5. Write a query to compare monthly sales for the year 2015. Copy and paste the results in Excel. Create a date column first

Step by Step Solution

There are 3 Steps involved in it

1 Expert Approved Answer
Step: 1 Unlock blur-text-image
Question Has Been Solved by an Expert!

Get step-by-step solutions from verified subject matter experts

Step: 2 Unlock
Step: 3 Unlock

Students Have Also Explored These Related General Management Questions!