

Question: 1 . Write Python code to read your CSV file in Jupyter Notebook. 2 . Write Python code to read the first 5 records and
Write Python code to read your CSV file in Jupyter Notebook.
Write Python code to read the first records and the last records of your CSV file.
Write Python code to get the summary of your dataset. The result should look like below
Write Python code to get the statistics of your dataset as below approx
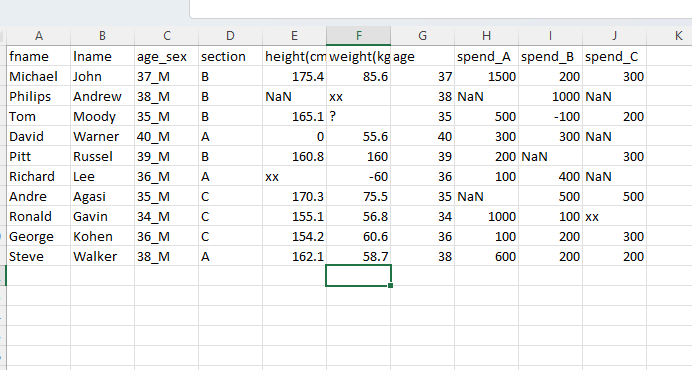
There is a column named agesex see fig. below Could you split that column and make two extra columns called sex and age?
Now the column agesex is no longer needed. Can you remove that column and produce the updated output?
Write Python code to Reorder the columns as below
Replace the following negative values see fig. below to its positive values, such replace to etc.
You might have noticed from the above screen shot that one of the persons height is and other ones weight is kg Obviously, these are outlierswrong data. Can you replace them with their respective average please?
Write your python code to calculate the null values of each column?
Replace the NaN values with their respective averagemedian values and display the whole table and take a screen shot.
Write your python code to calculate the null values of each column again after replacing NaN with average
Create a Bar chart for weight.
Create a histogram for height.
Create a scatter plot between height x and weight y
Step by Step Solution
There are 3 Steps involved in it
1 Expert Approved Answer
Step: 1 Unlock

Question Has Been Solved by an Expert!
Get step-by-step solutions from verified subject matter experts
Step: 2 Unlock
Step: 3 Unlock