

Question: 1. You are the operations manager at a Malaysian electronics manufacturing company. The company is seeking to improve its manufacturing processes and gain a
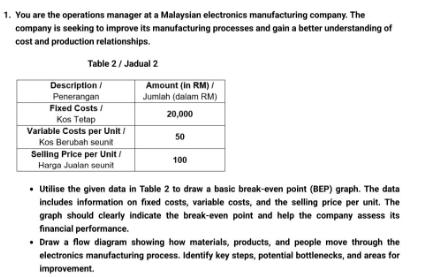
1. You are the operations manager at a Malaysian electronics manufacturing company. The company is seeking to improve its manufacturing processes and gain a better understanding of cost and production relationships. Table 2/Jadual 2 Description / Penerangan Fixed Costs/ Kos Tetap Variable Costs per Unit/ Kos Berubah seunit Selling Price per Unit/ Harga Jualan seunit Amount (in RM)/ Jumlah (dalam RM) 20,000 50 100 Utilise the given data in Table 2 to draw a basic break-even point (BEP) graph. The data includes information on fixed costs, variable costs, and the selling price per unit. The graph should clearly indicate the break-even point and help the company assess its financial performance. Draw a flow diagram showing how materials, products, and people move through the electronics manufacturing process. Identify key steps, potential bottlenecks, and areas for improvement.
Step by Step Solution
3.47 Rating (150 Votes )
There are 3 Steps involved in it
To draw a basic breakeven point BEP graph based on the given data in Table 2 follow these steps 1 Determine the breakeven point BEP The breakeven point is the level of production where total revenue e... View full answer

Get step-by-step solutions from verified subject matter experts