

1. You will drive around for twenty minutes. Spend no more than half your time on the...
Question:
1. You will drive around for twenty minutes. Spend no more than half your time on the freeway. Obey all traffic laws. Driver needs to concentrate on driving; Passenger needs to concentrate on the time and recording the information.
Before you start the trip, record the odometer reading on the 3 x 5 card.
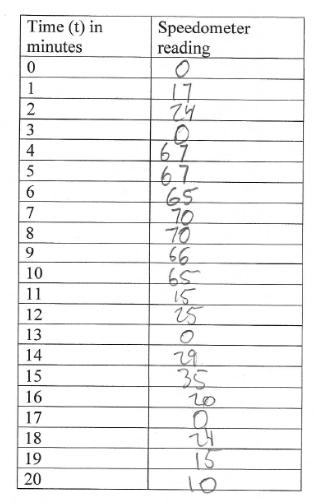
2. At the end of each minute during your car ride, Passenger will ask Driver for the speedometer (miles per hour) reading. Passenger will fill in this table.
3. Make a graph of your data on paper. Let t (time) be the horizontal axis in minutes and let v (velocity) be the vertical axis in miles per hour.
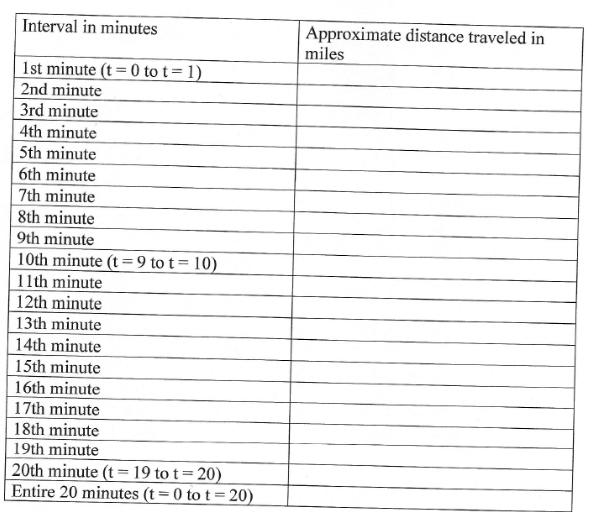
4. Remember that distance = rate times time for constant speeds. Use the speedometer reading chart or your scatter plot to fill in the chart below by indicating approximately how far you traveled during each interval. (Pay attention to your units!)
5. Compare your estimate of the total distance with the actual total distance (from your 3 x 5 card). How close was your estimate?
6. Remember that average velocity is total distance divided by total time. Compute your average velocity for the trip (use your real total distance from the 3 x 5 card, not your estimate). Draw a horizontal line on your graph at this velocity. The line finishes a rectangle, whose left edge is the line t=0, right edge is t=20, and bottom edge is v=0. What is the area of the rectangle? What does that area represent? What other region on your graph has approximately the same area?
Expert Answer:
Firstwavelength max 570 nm Second wavelength 2 400 nm a The thresholdwavelength d... View the full answer


Essential Statistics in Business and Economics
ISBN: 978-1260239508
3rd edition
Authors: David Doane, Lori Seward
