

Question: 10. 11. 12. 13. 14. 15. 16. Attach the graph to your data report. Use Excel to plot the relationship between (Q2, U), using Q2
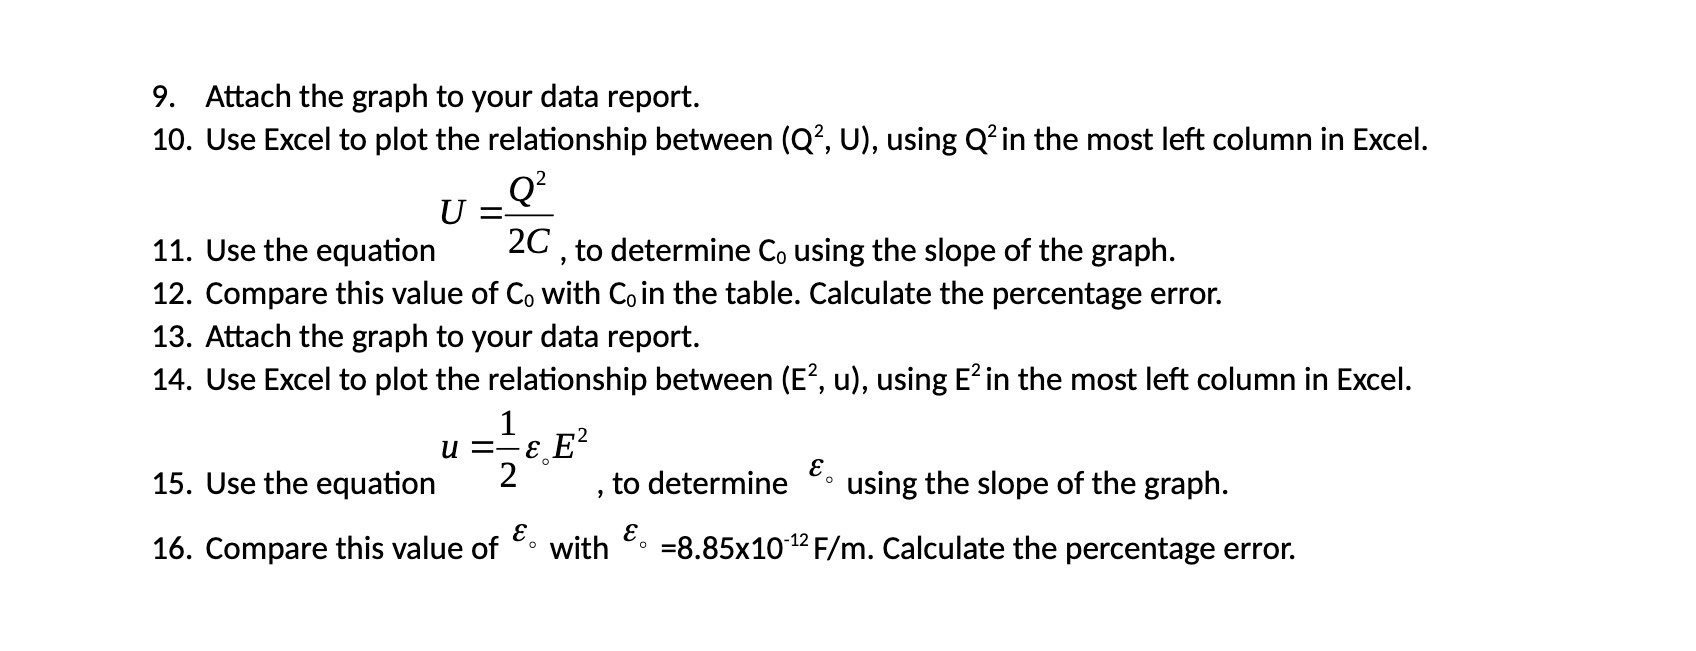
10. 11. 12. 13. 14. 15. 16. Attach the graph to your data report. Use Excel to plot the relationship between (Q2, U), using Q2 in the most left column in Excel. 2 U :0 Use the equation 2C , to determine Co using the slope of the graph. Compare this value of Co with Coin the table. Calculate the percentage error. Attach the graph to your data report. Use Excel to plot the relationship between (E, u), using E2 in the most left column in Excel. u =1 EOEZ Use the equation 2 , to determine 8 using the slope of the graph. Compare this value of 8 with 80 =8.85x10'12 F/m. Calculate the percentage error
Step by Step Solution
There are 3 Steps involved in it
1 Expert Approved Answer
Step: 1 Unlock

Question Has Been Solved by an Expert!
Get step-by-step solutions from verified subject matter experts
Step: 2 Unlock
Step: 3 Unlock