

Question: #10 9. Load the titanic data. Using pipes, create a data frame that only contains the pclass, sex, and age columns, and only for the
#10 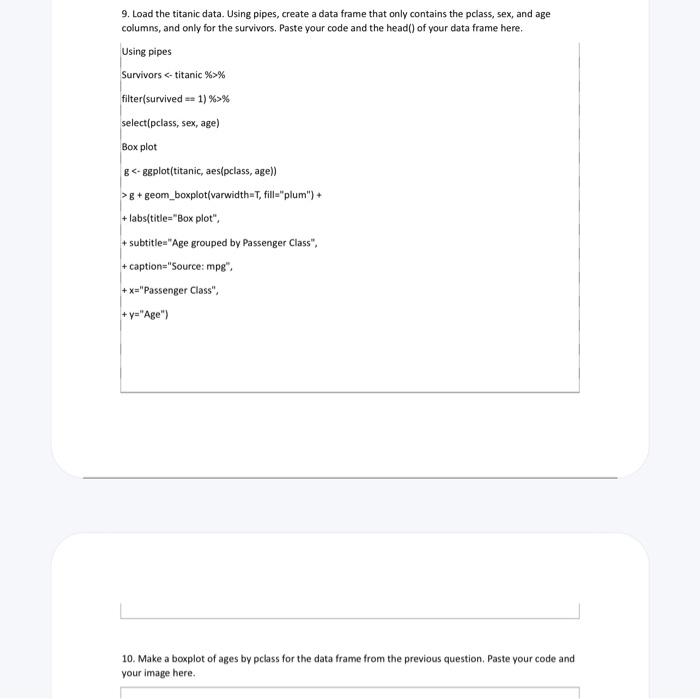
9. Load the titanic data. Using pipes, create a data frame that only contains the pclass, sex, and age columns, and only for the survivors. Paste your code and the head() of your data frame here. Using pipes Survivors %>% filter(survived =1)%>% select(pclass, sex, age) Boxplot g > g + geom_boxplot(varwidth=T, fille"plum") + + labs/title = "Box plot", + subtitle="Age grouped by Passenger Class". + caption="Source: mpg", +x= "Passenger Class", +y=" Age") 10. Make a boxplot of ages by pclass for the data frame from the previous question. Paste your code and your image here
Step by Step Solution
There are 3 Steps involved in it
1 Expert Approved Answer
Step: 1 Unlock

Question Has Been Solved by an Expert!
Get step-by-step solutions from verified subject matter experts
Step: 2 Unlock
Step: 3 Unlock