

Question: 10. A box plot is shown below. (7 points) 50 60 70 80 90 100 110 WEIGHT Estimate the following a. First quartile, Q1 b.
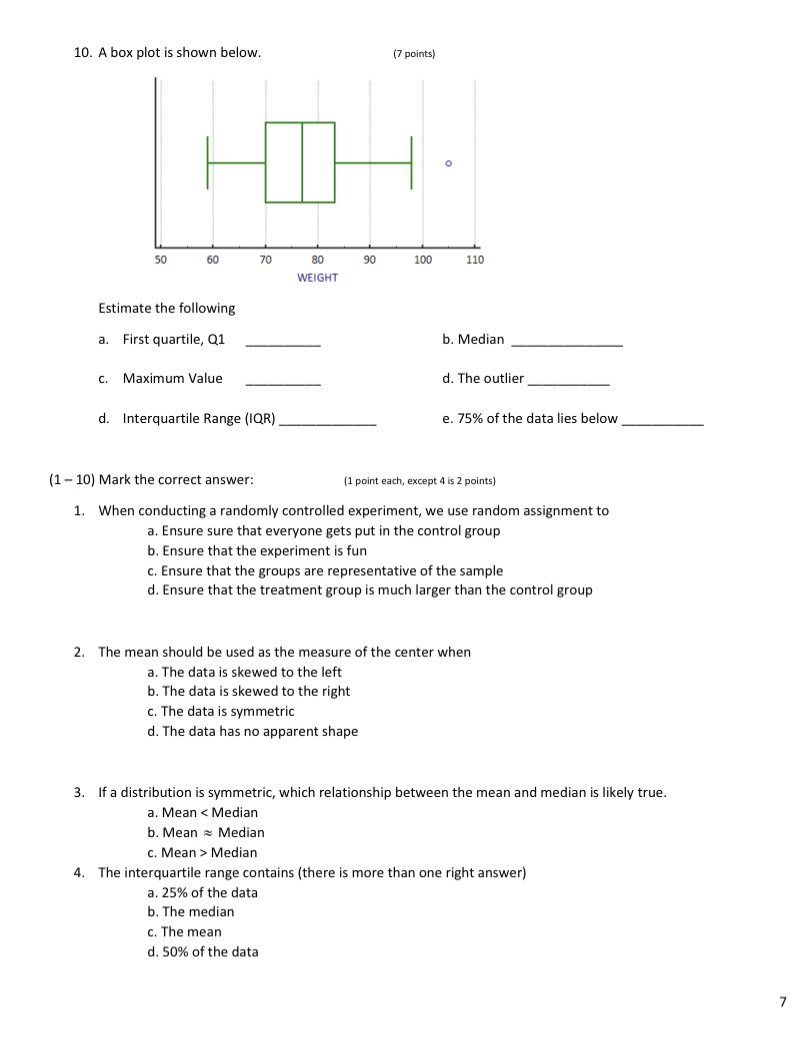
10. A box plot is shown below. (7 points) 50 60 70 80 90 100 110 WEIGHT Estimate the following a. First quartile, Q1 b. Median c. Maximum Value d. The outlier d. Interquartile Range (IQR) e. 75% of the data lies below (1 - 10) Mark the correct answer: (1 point each, except 4 is 2 points) 1. When conducting a randomly controlled experiment, we use random assignment to a. Ensure sure that everyone gets put in the control group b. Ensure that the experiment is fun c. Ensure that the groups are representative of the sample d. Ensure that the treatment group is much larger than the control group 2. The mean should be used as the measure of the center when a. The data is skewed to the left b. The data is skewed to the right c. The data is symmetric d. The data has no apparent shape 3. If a distribution is symmetric, which relationship between the mean and median is likely true. a. Mean Median 4. The interquartile range contains (there is more than one right answer) a. 25% of the data b. The median c. The mean d. 50% of the data 7
Step by Step Solution
There are 3 Steps involved in it

Get step-by-step solutions from verified subject matter experts