

Question: 10. A polyethylene polymer sample is analyzed and the data is shown in the table below. (a) Plot a histogram of number fraction as function
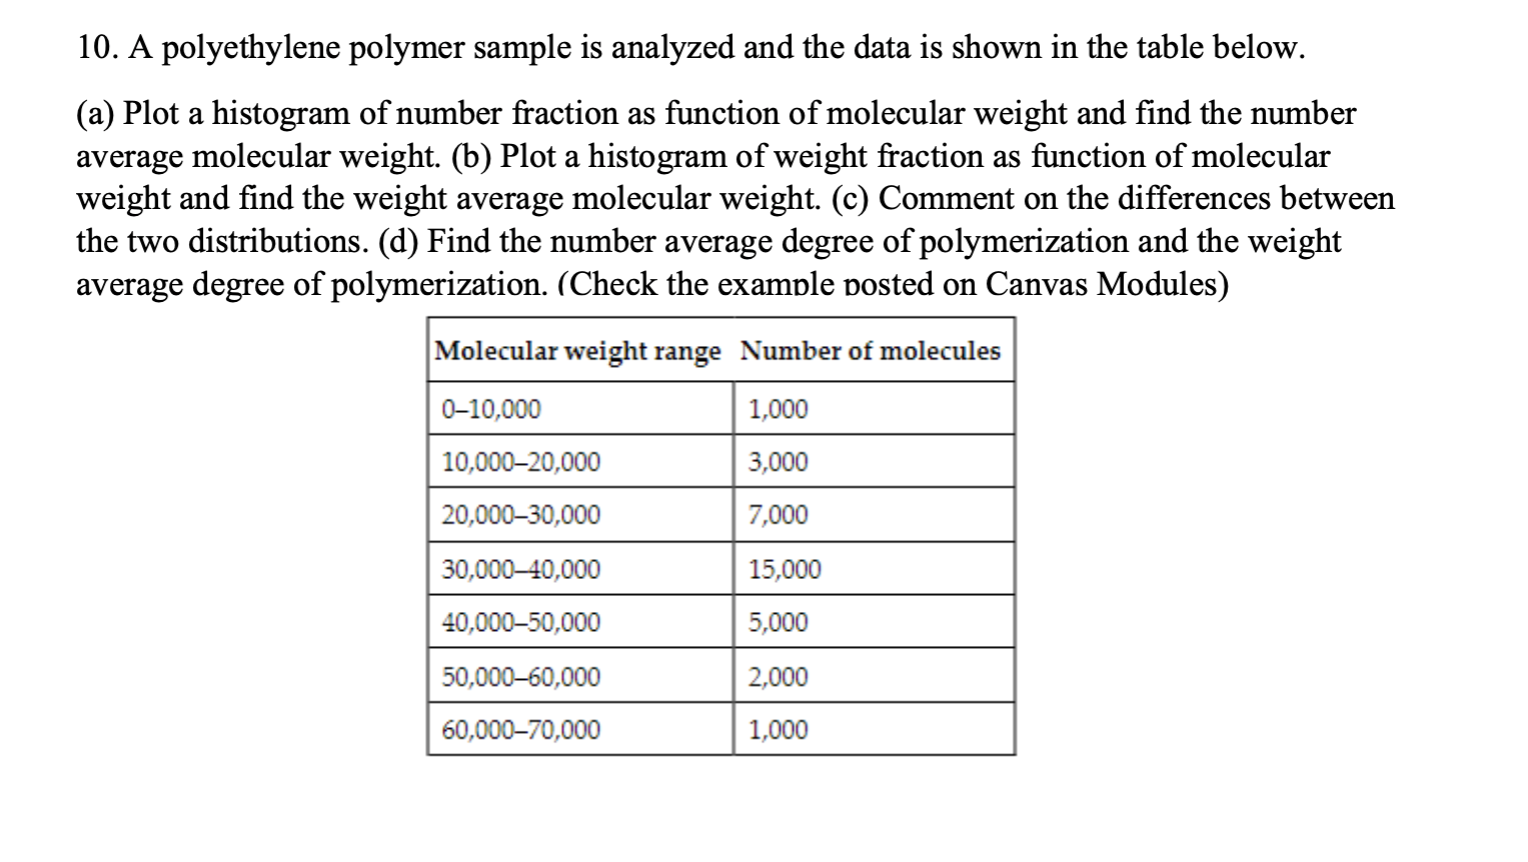
10. A polyethylene polymer sample is analyzed and the data is shown in the table below. (a) Plot a histogram of number fraction as function of molecular weight and find the number average molecular weight. (b) Plot a histogram of weight fraction as function of molecular weight and find the weight average molecular weight. (c) Comment on the differences between the two distributions. (d) Find the number average degree of polymerization and the weight average degree of polymerization. (Check the example posted on Canvas Modules)
Step by Step Solution
There are 3 Steps involved in it
1 Expert Approved Answer
Step: 1 Unlock

Question Has Been Solved by an Expert!
Get step-by-step solutions from verified subject matter experts
Step: 2 Unlock
Step: 3 Unlock