

Question: 10. A regression line for the data is shown. Estimate the correlation, r. a. -1 b. -0.9 0.8 C. -0.5 d. 0.1 0.7 e. 0
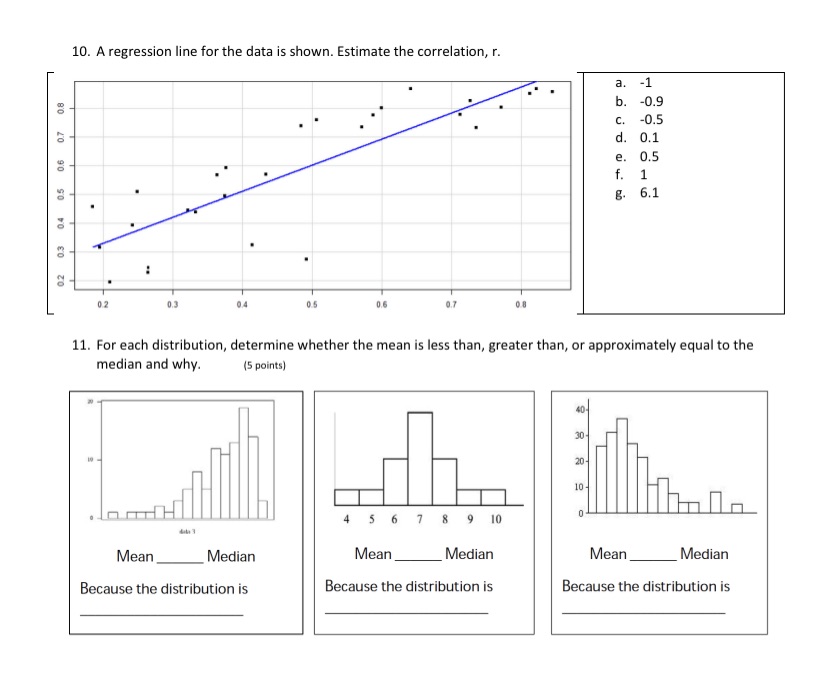
10. A regression line for the data is shown. Estimate the correlation, r. a. -1 b. -0.9 0.8 C. -0.5 d. 0.1 0.7 e. 0 .5 0.6 f. 1 6.1 0.5 0.4 03 0.2 02 0.3 04 0.5 0.6 11. For each distribution, determine whether the mean is less than, greater than, or approximately equal to the median and why. (5 points) 40- 30 20 10 6 7 8 9 10 Mean Median Mean Median Mean Median Because the distribution is Because the distribution is Because the distribution is
Step by Step Solution
There are 3 Steps involved in it
1 Expert Approved Answer
Step: 1 Unlock

Question Has Been Solved by an Expert!
Get step-by-step solutions from verified subject matter experts
Step: 2 Unlock
Step: 3 Unlock