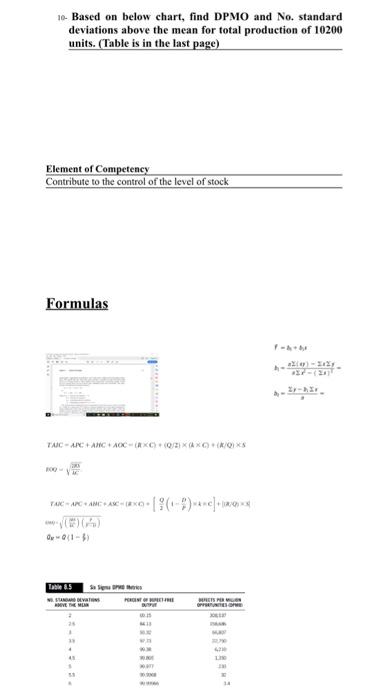
Question: 10- Based on below chart, find DPMO and No. standard deviations above the mean for total production of 10200 units. (Table is in the last

10- Based on below chart, find DPMO and No.
10- Based on below chart, find DPMO and No. standard deviations above the mean for total production of 10200 units. (Table is in the last page) Element of Competency Contribute to the control of the level of stock Formulas TAC - ARCANC+ ACCXCIXXOOXS TAKARCACAO xo-|(1) c] IAQ Table 85 Salt NO RES 10- Based on below chart, find DPMO and No. standard deviations above the mean for total production of 10200 units. (Table is in the last page) Element of Competency Contribute to the control of the level of stock Formulas TAC - ARCANC+ ACCXCIXXOOXS TAKARCACAO xo-|(1) c] IAQ Table 85 Salt NO RES

Step by Step Solution

There are 3 Steps involved in it

1 Expert Approved Answer
Step: 1 Unlock blur-text-image
Question Has Been Solved by an Expert!

Get step-by-step solutions from verified subject matter experts

Step: 2 Unlock
Step: 3 Unlock

Students Have Also Explored These Related General Management Questions!