

Question: 10) Ch 11 ( The Chi-square Distribution ) An article in the New England Journal of Medicine presented a study on smokers in California and
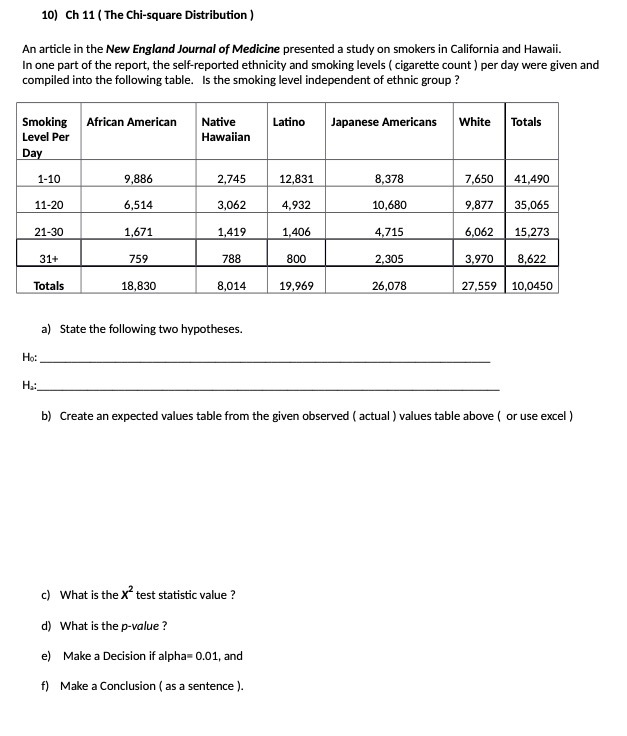
10) Ch 11 ( The Chi-square Distribution ) An article in the New England Journal of Medicine presented a study on smokers in California and Hawaii. In one part of the report, the self-reported ethnicity and smoking levels ( cigarette count ) per day were given and compiled into the following table. Is the smoking level independent of ethnic group ? Smoking African American Native Latino Japanese Americans White Totals Level Per Hawaiian Day 1-10 9.886 2,745 12,831 8,378 7,650 41,490 11-20 6,514 3,062 4,932 10,680 9.877 35,065 21-30 1,671 1,419 1,406 4,715 6,062 15,273 31+ 759 788 800 2,305 3,970 8,622 Totals 18,830 8,014 19,969 26,078 27,559 10,0450 a) State the following two hypotheses. Ho: H.: b) Create an expected values table from the given observed ( actual ) values table above ( or use excel ) c) What is the X" test statistic value ? d) What is the p-value ? e) Make a Decision if alpha= 0.01, and f) Make a Conclusion ( as a sentence )
Step by Step Solution
There are 3 Steps involved in it

Get step-by-step solutions from verified subject matter experts