

Question: 10. Choices a) Identify the scatter plot for the data 35-0 b) 30.0 30' 25.0 25.0 5' 9 20.0 ;: 20.0 z. E: 15.0 g,
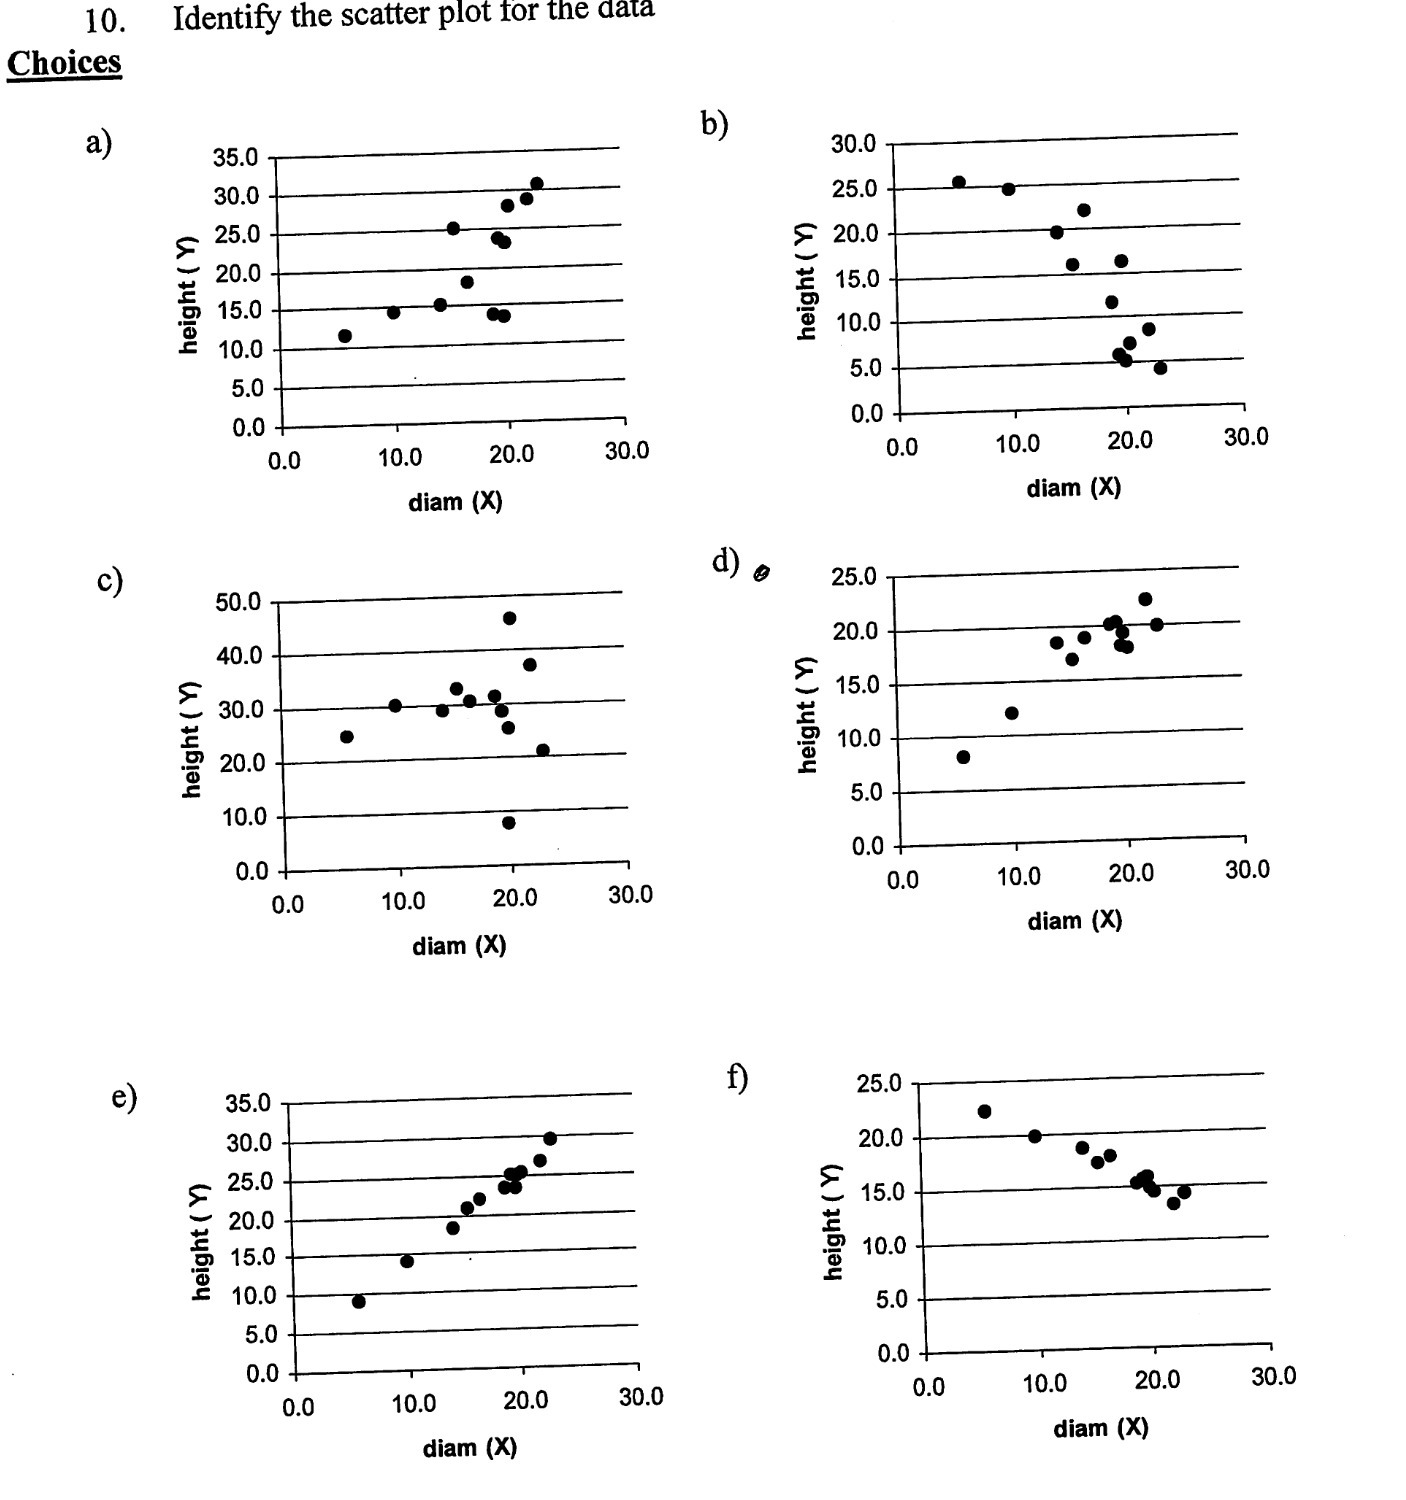

10. Choices a) Identify the scatter plot for the data 35-0 b) 30.0 30'\" 25.0 25.0 5'" 9 20.0 ;: 20.0 z. E: 15.0 g, 15-0 3 10.0 2 10-0 5.0 5.0 0.0 (m 0.0 10-0 20.0 30-0 0.0 10.0 20.0 30.0 mm (X) diam (X) 50.0 d) 9 25.0 40.0 20.0 E 30.0 E 15.0 v E E' 20.0 --',' 10.0 A: .E 10.0 5.0 0.0 0.0 0.0 10.0 20.0 30.0 0-0 10-0 20.0 30-0 diam (X) diam (X) 35.0 f) 25.0 0 30'\" 20.0 . E 20.0 :: 5- J: g 15-0 .g' 10.0 -= 10.0 s 5.0 5.0 0.0 0.0 0.0 10.0 20.0 30.0 0.0 10.0 20.0 30.0 diam (X) diam (X)
Step by Step Solution
There are 3 Steps involved in it
1 Expert Approved Answer
Step: 1 Unlock

Question Has Been Solved by an Expert!
Get step-by-step solutions from verified subject matter experts
Step: 2 Unlock
Step: 3 Unlock