

Question: 10. Examine the given run chart or control chart and determine whether the process is within statistical control. If it is not, identify which
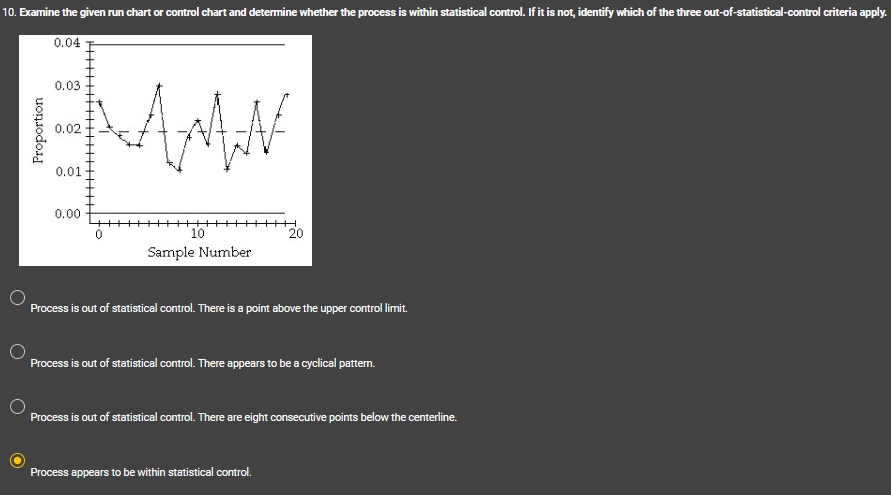
10. Examine the given run chart or control chart and determine whether the process is within statistical control. If it is not, identify which of the three out-of-statistical-control criteria apply. 0.04 Proportion 0.03 0.02 0.01 AMN 0.00 10 Sample Number H 20 Process is out of statistical control. There is a point above the upper control limit. Process is out of statistical control. There appears to be a cyclical pattern. Process is out of statistical control. There are eight consecutive points below the centerline. Process appears to be within statistical control.
Step by Step Solution
There are 3 Steps involved in it
1 Expert Approved Answer
Step: 1 Unlock

Question Has Been Solved by an Expert!
Get step-by-step solutions from verified subject matter experts
Step: 2 Unlock
Step: 3 Unlock