

Question: 10. Given the ideal phase diagram for a complete solubility in the solid state in Fig. A. Please draw the cooling curve for the pure
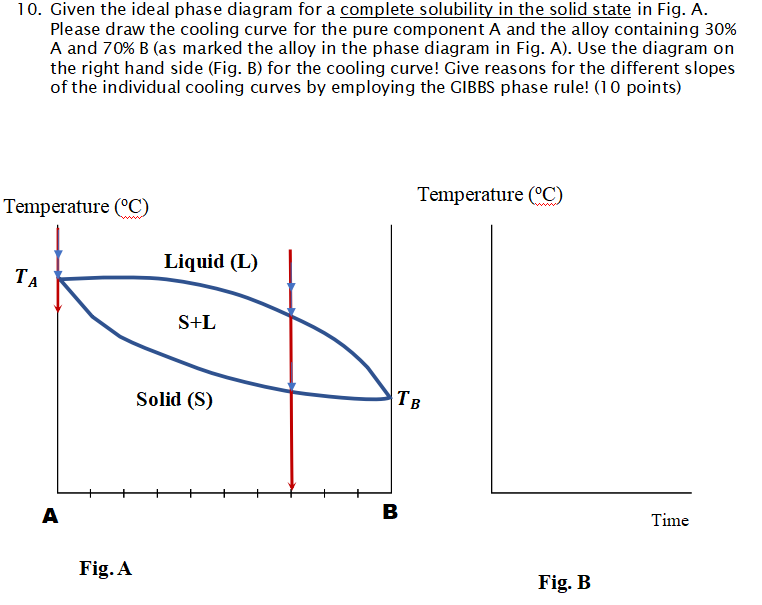
10. Given the ideal phase diagram for a complete solubility in the solid state in Fig. A. Please draw the cooling curve for the pure component A and the alloy containing 30% A and 70% B (as marked the alloy in the phase diagram in Fig. A). Use the diagram on the right hand side (Fig. B) for the cooling curve! Give reasons for the different slopes of the individual cooling curves by employing the GIBBS phase rule! (10 points) Temperature C) Temperature (C) Liquid (L) TA S+L Solid (S) B Time Fig. A Fig. B
Step by Step Solution
There are 3 Steps involved in it
1 Expert Approved Answer
Step: 1 Unlock

Question Has Been Solved by an Expert!
Get step-by-step solutions from verified subject matter experts
Step: 2 Unlock
Step: 3 Unlock