Question: 10. In Chapter 4, you worked with data on sales for a line of skiwear that is produced by HeathCo Industries. Barbara Lynch, the product
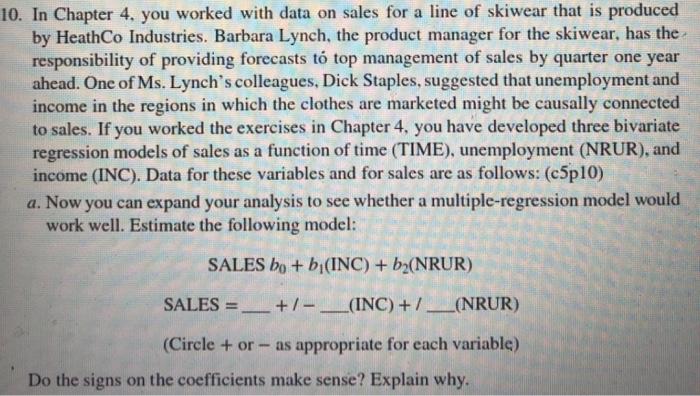
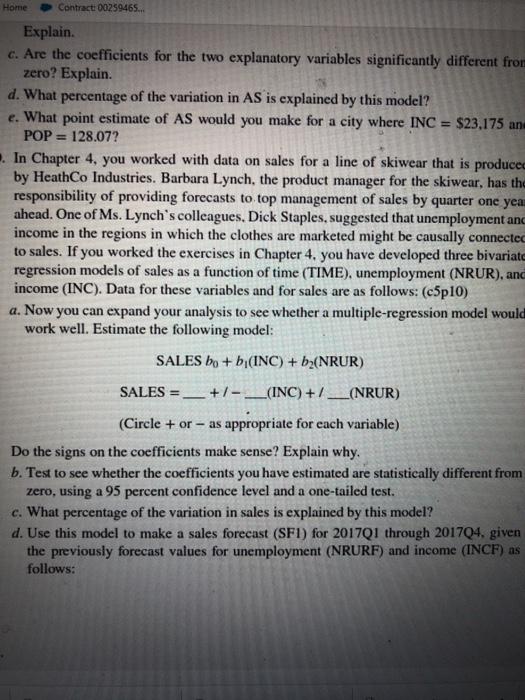
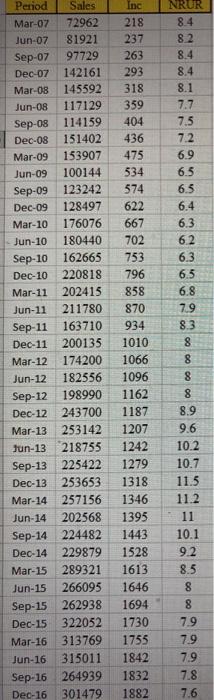
10. In Chapter 4, you worked with data on sales for a line of skiwear that is produced by HeathCo Industries. Barbara Lynch, the product manager for the skiwear, has the responsibility of providing forecasts to top management of sales by quarter one year ahead. One of Ms. Lynch's colleagues, Dick Staples, suggested that unemployment and income in the regions in which the clothes are marketed might be causally connected to sales. If you worked the exercises in Chapter 4, you have developed three bivariate regression models of sales as a function of time (TIME), unemployment (NRUR), and income (INC). Data for these variables and for sales are as follows: (c5p10) a. Now you can expand your analysis to see whether a multiple-regression model would work well. Estimate the following model: SALES bo + b (INC) + b2(NRUR) SALES = __+- _(INC) + / __(NRUR) (Circle + or - as appropriate for each variable) Do the signs on the coefficients make sense? Explain why. Home Contract: 00259465... Explain. c. Are the coefficients for the two explanatory variables significantly different from zero? Explain. d. What percentage of the variation in AS is explained by this model? e. What point estimate of AS would you make for a city where INC = $23,175 an POP 128.072 In Chapter 4, you worked with data on sales for a line of skiwear that is produced by HeathCo Industries. Barbara Lynch, the product manager for the skiwear, has the responsibility of providing forecasts to top management of sales by quarter one yea ahead. One of Ms. Lynch's colleagues, Dick Staples, suggested that unemployment and income in the regions in which the clothes are marketed might be causally connected to sales. If you worked the exercises in Chapter 4, you have developed three bivariate regression models of sales as a function of time (TIME), unemployment (NRUR), and income (INC). Data for these variables and for sales are as follows: (c5p10) a. Now you can expand your analysis to see whether a multiple-regression model would work well. Estimate the following model: SALES bo + b (INC) + b (NRUR) SALES = _ +/- ___(INC) + / (NRUR) (Circle + or - as appropriate for each variable) Do the signs on the coefficients make sense? Explain why. b. Test to see whether the coefficients you have estimated are statistically different from zero, using a 95 percent confidence level and a one-tailed test. c. What percentage of the variation in sales is explained by this model? d. Use this model to make a sales forecast (SFI) for 201701 through 201704. given the previously forecast values for unemployment (NRURF) and income (INCF) as follows: NRUR 8.4 82 8.4 8.4 8.1 7.7 7.5 7.2 6.9 6.5 6.5 6.4 6.3 62 6.3 6.5 6.8 7.9 8.3 Period Sales Mar-07 72962 Jun-07 81921 Sep-07 97729 Dec-07 142161 Mar-08 145592 Jun-08 117129 Sep-08 114159 Dec-08 151402 Mar-09 153907 Jun-09 100144 Sep-09 123242 Dec-09 128497 Mar-10 176076 Jun-10 180440 Sep-10 162665 Dec-10 220818 Mar-11 202415 Jun-11 211780 Sep-11 163710 Dec-11 200135 Mar-12 174200 Jun-12 182556 Sep-12 198990 Dec-12 243700 Mar-13 253142 Jun-13218755 Sep-13 225422 Dec-13 253653 Mar-14 257156 Jun-14 202568 Sep-14 224482 Dec-14 229879 Mar-15 289321 Jun-15 266095 Sep-15 262938 Dec-15 322052 Mar-16 313769 Jun-16 315011 Sep-16 264939 Dec-16 301479 Inc 218 237 263 293 318 359 404 436 475 534 574 622 667 702 753 796 858 870 934 1010 1066 1096 1162 1187 1207 1242 1279 1318 1346 1395 1443 1528 1613 1646 1694 1730 1753 1842 1832 1882 8 8 8.9 9.6 10.2 10.7 11.5 11.2 11 10.1 92 8.5 8 8 7.9 7.9 7.9 7.8 7.6 10. In Chapter 4, you worked with data on sales for a line of skiwear that is produced by HeathCo Industries. Barbara Lynch, the product manager for the skiwear, has the responsibility of providing forecasts to top management of sales by quarter one year ahead. One of Ms. Lynch's colleagues, Dick Staples, suggested that unemployment and income in the regions in which the clothes are marketed might be causally connected to sales. If you worked the exercises in Chapter 4, you have developed three bivariate regression models of sales as a function of time (TIME), unemployment (NRUR), and income (INC). Data for these variables and for sales are as follows: (c5p10) a. Now you can expand your analysis to see whether a multiple-regression model would work well. Estimate the following model: SALES bo + b (INC) + b2(NRUR) SALES = __+- _(INC) + / __(NRUR) (Circle + or - as appropriate for each variable) Do the signs on the coefficients make sense? Explain why. Home Contract: 00259465... Explain. c. Are the coefficients for the two explanatory variables significantly different from zero? Explain. d. What percentage of the variation in AS is explained by this model? e. What point estimate of AS would you make for a city where INC = $23,175 an POP 128.072 In Chapter 4, you worked with data on sales for a line of skiwear that is produced by HeathCo Industries. Barbara Lynch, the product manager for the skiwear, has the responsibility of providing forecasts to top management of sales by quarter one yea ahead. One of Ms. Lynch's colleagues, Dick Staples, suggested that unemployment and income in the regions in which the clothes are marketed might be causally connected to sales. If you worked the exercises in Chapter 4, you have developed three bivariate regression models of sales as a function of time (TIME), unemployment (NRUR), and income (INC). Data for these variables and for sales are as follows: (c5p10) a. Now you can expand your analysis to see whether a multiple-regression model would work well. Estimate the following model: SALES bo + b (INC) + b (NRUR) SALES = _ +/- ___(INC) + / (NRUR) (Circle + or - as appropriate for each variable) Do the signs on the coefficients make sense? Explain why. b. Test to see whether the coefficients you have estimated are statistically different from zero, using a 95 percent confidence level and a one-tailed test. c. What percentage of the variation in sales is explained by this model? d. Use this model to make a sales forecast (SFI) for 201701 through 201704. given the previously forecast values for unemployment (NRURF) and income (INCF) as follows: NRUR 8.4 82 8.4 8.4 8.1 7.7 7.5 7.2 6.9 6.5 6.5 6.4 6.3 62 6.3 6.5 6.8 7.9 8.3 Period Sales Mar-07 72962 Jun-07 81921 Sep-07 97729 Dec-07 142161 Mar-08 145592 Jun-08 117129 Sep-08 114159 Dec-08 151402 Mar-09 153907 Jun-09 100144 Sep-09 123242 Dec-09 128497 Mar-10 176076 Jun-10 180440 Sep-10 162665 Dec-10 220818 Mar-11 202415 Jun-11 211780 Sep-11 163710 Dec-11 200135 Mar-12 174200 Jun-12 182556 Sep-12 198990 Dec-12 243700 Mar-13 253142 Jun-13218755 Sep-13 225422 Dec-13 253653 Mar-14 257156 Jun-14 202568 Sep-14 224482 Dec-14 229879 Mar-15 289321 Jun-15 266095 Sep-15 262938 Dec-15 322052 Mar-16 313769 Jun-16 315011 Sep-16 264939 Dec-16 301479 Inc 218 237 263 293 318 359 404 436 475 534 574 622 667 702 753 796 858 870 934 1010 1066 1096 1162 1187 1207 1242 1279 1318 1346 1395 1443 1528 1613 1646 1694 1730 1753 1842 1832 1882 8 8 8.9 9.6 10.2 10.7 11.5 11.2 11 10.1 92 8.5 8 8 7.9 7.9 7.9 7.8 7.6