

Question: 10. Look at the following sample of MATLAB code (which has line numbers added for ease of reference) and answer the following questions about it.
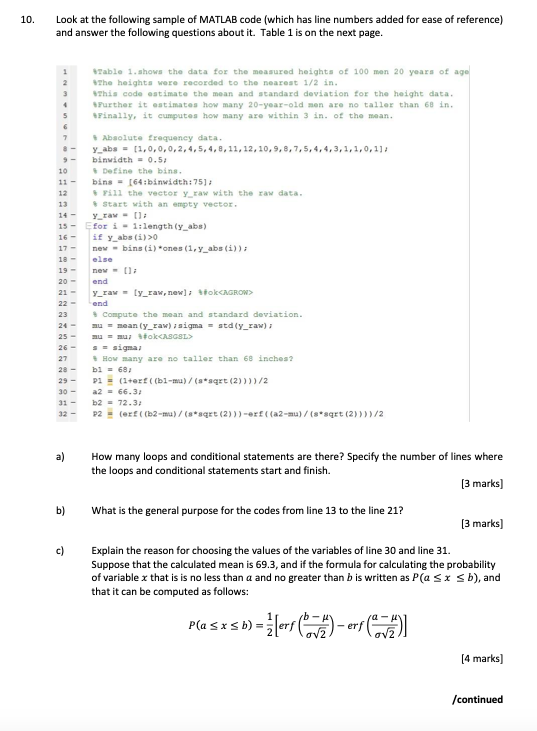
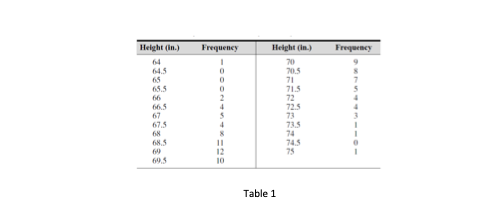
10. Look at the following sample of MATLAB code (which has line numbers added for ease of reference) and answer the following questions about it. Table 1 is on the next page. 2 3 Table 1. shows the data for the measured heights of 100 men 20 years of age The heights were recorded to the nearest 1/2 in. This code estimate the mean and standard deviation for the height data. Further it estimates how many 20-year-old men are no taller than 68 in. Finally, it cumputes how many are within 3 in. of the mean. 5 7 Absolute frequency data. Y_abs = 11,0,0,0,2,4,5,4,8, 11, 12, 10, 9, 8, 7,5,4,4,3,1,1,0,1)) binwidth = 0.5; 10 Define the bins. bins - [64:binwidth:75): 12 Fill the vector y_raw with the raw data. 13 Start with an empty vector. Y_raw- 15 - Efor 1-1. length (y_abs) 16 - if y_abs (i)>0 17 - new-bins (i) ones (1,Y_abs(i)); 18- else 19- new- 20- end 21 - Y_raw-ly_raw, new]; Stok GROW> 22 - end 23 Compute the mean and standard deviation. 24- mu = mean (y_raw) sigma = std{y_raw) 25 - mumkCASGEL> 26- s = signa: 27 How many are no taller than 68 inches? bl = 687 P1 = (1+ert((b1-mu)/(a+sqrt(2))))/2 30 - a2 = 66.3; b2 = 72.31 P2 = (erf ( (b2-ma)/(a+sqrt (2)))-er{(a2-mu)/(a+sqrt (2)}}}/2 b) c) How many loops and conditional statements are there? Specify the number of lines where the loops and conditional statements start and finish. [3 marks) What is the general purpose for the codes from line 13 to the line 21? [3 marks] Explain the reason for choosing the values of the variables of line 30 and line 31. Suppose that the calculated mean is 69.3, and if the formula for calculating the probability of variable x that is is no less than a and no greater than b is written as Pasx sb), and that it can be computed as follows: Pa Sxsb) = = }LF (**)-ers ( (4 marks) / continued Height (in.) Frequency Frequency 64.5 0 0 65.5 Height (in.) 70 70.5 71 71.5 72 72.5 73 715 66.5 67 675 68 68.5 60 11 745 75 10 Table 1 10. Look at the following sample of MATLAB code (which has line numbers added for ease of reference) and answer the following questions about it. Table 1 is on the next page. 2 3 Table 1. shows the data for the measured heights of 100 men 20 years of age The heights were recorded to the nearest 1/2 in. This code estimate the mean and standard deviation for the height data. Further it estimates how many 20-year-old men are no taller than 68 in. Finally, it cumputes how many are within 3 in. of the mean. 5 7 Absolute frequency data. Y_abs = 11,0,0,0,2,4,5,4,8, 11, 12, 10, 9, 8, 7,5,4,4,3,1,1,0,1)) binwidth = 0.5; 10 Define the bins. bins - [64:binwidth:75): 12 Fill the vector y_raw with the raw data. 13 Start with an empty vector. Y_raw- 15 - Efor 1-1. length (y_abs) 16 - if y_abs (i)>0 17 - new-bins (i) ones (1,Y_abs(i)); 18- else 19- new- 20- end 21 - Y_raw-ly_raw, new]; Stok GROW> 22 - end 23 Compute the mean and standard deviation. 24- mu = mean (y_raw) sigma = std{y_raw) 25 - mumkCASGEL> 26- s = signa: 27 How many are no taller than 68 inches? bl = 687 P1 = (1+ert((b1-mu)/(a+sqrt(2))))/2 30 - a2 = 66.3; b2 = 72.31 P2 = (erf ( (b2-ma)/(a+sqrt (2)))-er{(a2-mu)/(a+sqrt (2)}}}/2 b) c) How many loops and conditional statements are there? Specify the number of lines where the loops and conditional statements start and finish. [3 marks) What is the general purpose for the codes from line 13 to the line 21? [3 marks] Explain the reason for choosing the values of the variables of line 30 and line 31. Suppose that the calculated mean is 69.3, and if the formula for calculating the probability of variable x that is is no less than a and no greater than b is written as Pasx sb), and that it can be computed as follows: Pa Sxsb) = = }LF (**)-ers ( (4 marks) / continued Height (in.) Frequency Frequency 64.5 0 0 65.5 Height (in.) 70 70.5 71 71.5 72 72.5 73 715 66.5 67 675 68 68.5 60 11 745 75 10 Table 1
Step by Step Solution
There are 3 Steps involved in it

Get step-by-step solutions from verified subject matter experts