

Question: (10 Marks) Q:2 Interpret the output or Regression Analysis based on SPSS. Table 2: Regression Output Standardized Unstandardized Coefficients Coefficients B Std. Error Beta Model
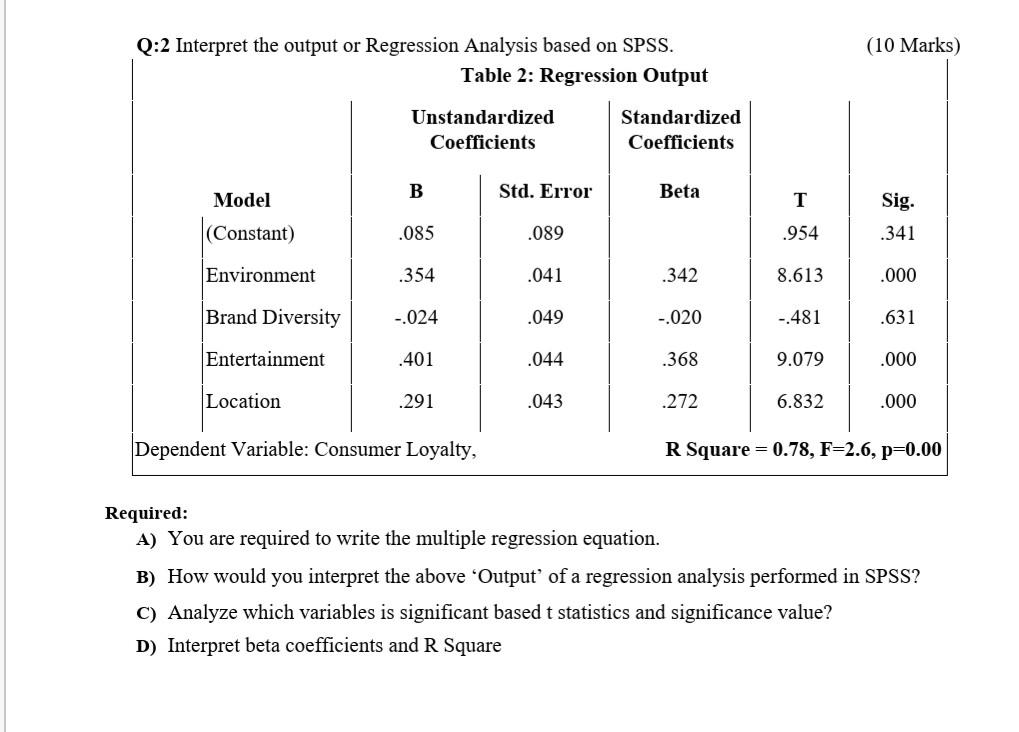
(10 Marks) Q:2 Interpret the output or Regression Analysis based on SPSS. Table 2: Regression Output Standardized Unstandardized Coefficients Coefficients B Std. Error Beta Model T Sig. (Constant) .085 .089 954 .341 Environment .354 .041 .342 8.613 .000 Brand Diversity -.024 .049 -.020 -.481 .631 Entertainment .401 .044 .368 9.079 .000 Location .291 .043 .272 6.832 .000 Dependent Variable: Consumer Loyalty, R Square = 0.78, F=2.6, p=0.00 Required: A) You are required to write the multiple regression equation. B) How would you interpret the above 'Output' of a regression analysis performed in SPSS? C) Analyze which variables is significant based t statistics and significance value? D) Interpret beta coefficients and R Square
Step by Step Solution
There are 3 Steps involved in it

Get step-by-step solutions from verified subject matter experts