

Question: 10 Multiple Choice Questions: (40 MARKS TOTAL-4 marks per question) Choose the most appropriate answer in each case. NEGATIVE MARKING (MINUS 1 for a wrong
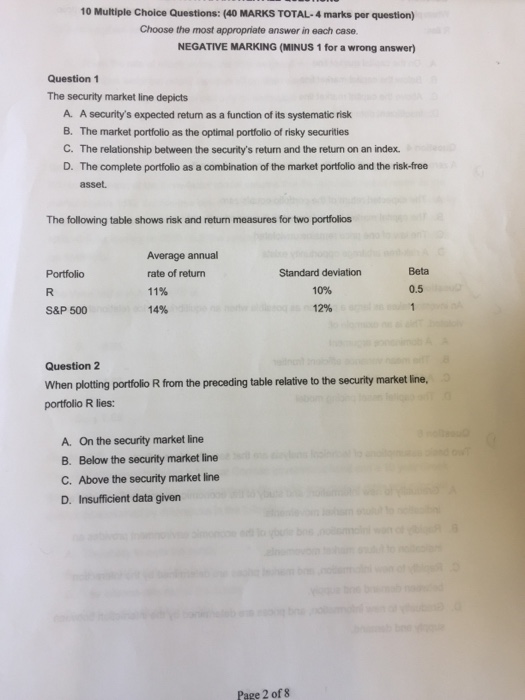
10 Multiple Choice Questions: (40 MARKS TOTAL-4 marks per question) Choose the most appropriate answer in each case. NEGATIVE MARKING (MINUS 1 for a wrong answer) Question 1 The security market line depicts A. A security's expected return as a function of its systematic risk B. The market portfolio as the optimal portfolio of risky securities C. The relationship between the security's return and the return on an index. D. The complete portfolio as a combination of the market portfolio and the risk-free asset. The following table shows risk and return measures for two portfolios Average annual rate of return 11% 14% Standard deviation 10% 12% Beta 0.5 Portfolio S&P 500 Question2 When plotting portfolio R from the preceding table relative to the security market line, portfolio R lies: A. On the security market line B. Below the security market line C. Above the security market line D. Insufficient data given Page 2 of 8
Step by Step Solution
There are 3 Steps involved in it

Get step-by-step solutions from verified subject matter experts