

Question: (10 points) Q2. Run the Segmentation model. What is the optimal number of segments? Why? (15 points) Q3. What are the key segments? Label each
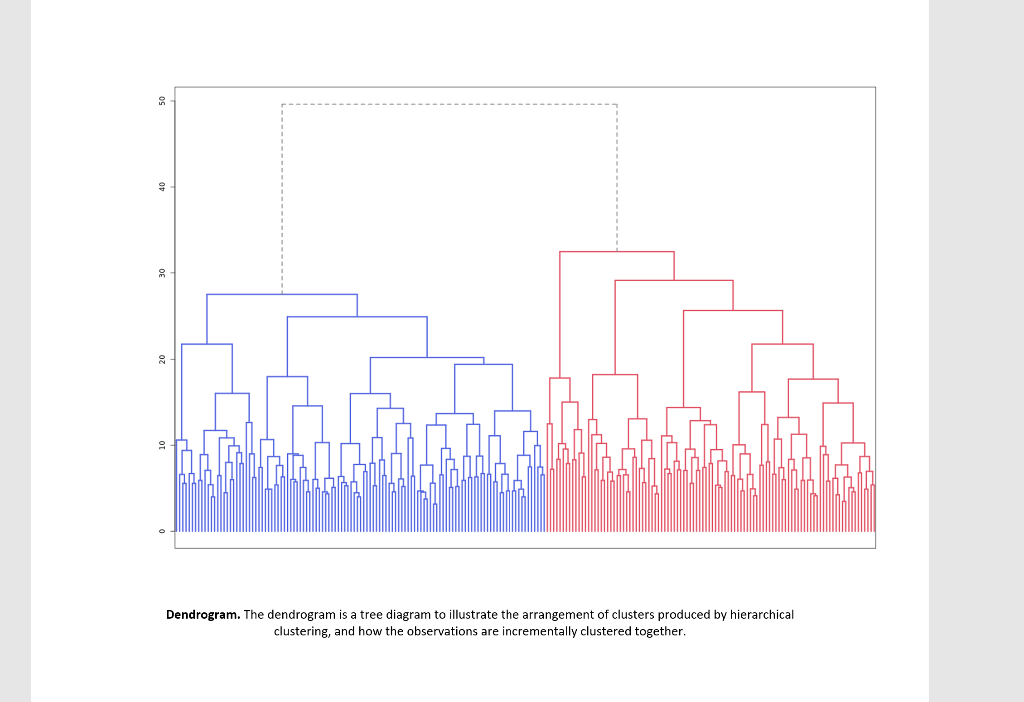
(10 points) Q2. Run the Segmentation model. What is the optimal number of segments? Why?
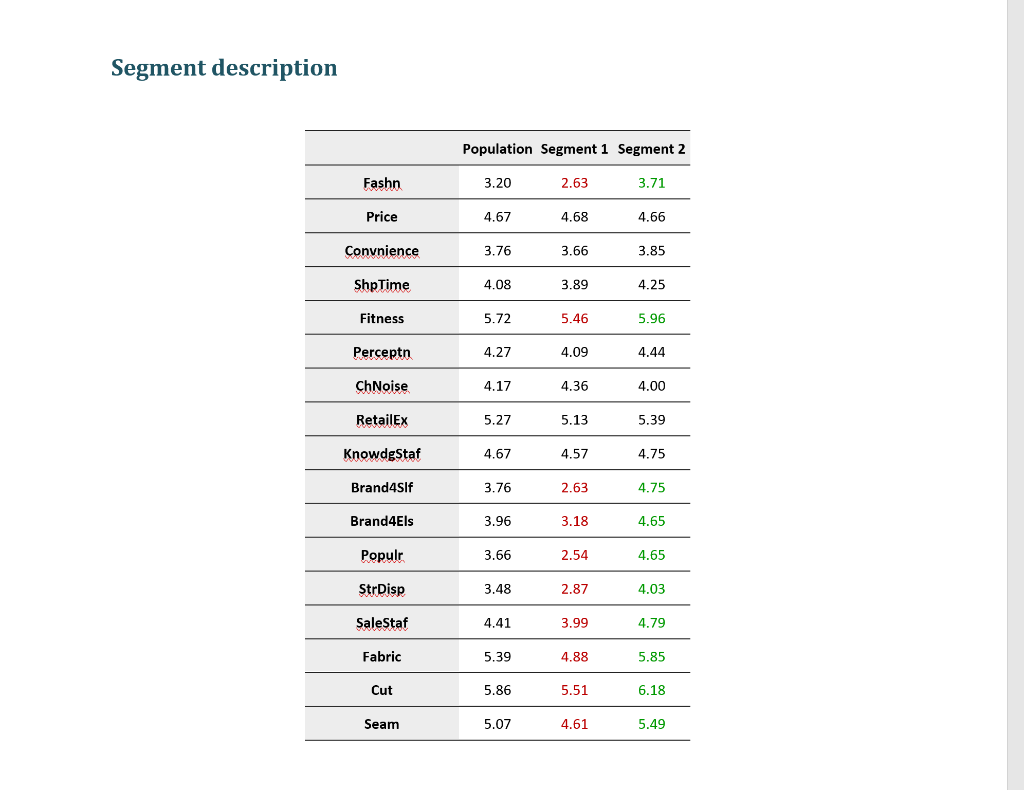
(15 points) Q3. What are the key segments? Label each segment in a way that best define the consumers who belong to that segment. Explain the profile of each segment according to the segmentation variables used in the analysis. What are some of the statistically significant differences between segments?
Segment description Population Segment 1 Segment 2 Fashn 3.20 2.63 3.71 Price 4.67 4.68 4.66 Convnience 3.76 3.66 3.85 ShpTime 4.08 3.89 4.25 Fitness 5.72 5.46 5.96 Perceptn 4.27 4.09 4.44 ChNoise 4.17 4.36 4.00 Retailex 5.27 5.13 5.39 KnowdgStaf 4.67 4.57 4.75 Brand4sIf 3.76 2.63 4.75 Brand4Els 3.96 3.18 4.65 Populr 3.66 2.54 4.65 StrDisp 3.48 2.87 4.03 SaleStaf 4.41 3.99 4.79 Fabric 5.39 4.88 5.85 Cut 5.86 5.51 6.18 Seam 5.07 4.61 5.49 40 . Inne de LA | Dendrogram. The dendrogram is a tree diagram to illustrate the arrangement of clusters produced by hierarchical clustering, and how the observations are incrementally clustered together, Segment description Population Segment 1 Segment 2 Fashn 3.20 2.63 3.71 Price 4.67 4.68 4.66 Convnience 3.76 3.66 3.85 ShpTime 4.08 3.89 4.25 Fitness 5.72 5.46 5.96 Perceptn 4.27 4.09 4.44 ChNoise 4.17 4.36 4.00 Retailex 5.27 5.13 5.39 KnowdgStaf 4.67 4.57 4.75 Brand4sIf 3.76 2.63 4.75 Brand4Els 3.96 3.18 4.65 Populr 3.66 2.54 4.65 StrDisp 3.48 2.87 4.03 SaleStaf 4.41 3.99 4.79 Fabric 5.39 4.88 5.85 Cut 5.86 5.51 6.18 Seam 5.07 4.61 5.49 40 . Inne de LA | Dendrogram. The dendrogram is a tree diagram to illustrate the arrangement of clusters produced by hierarchical clustering, and how the observations are incrementally clustered together
Step by Step Solution
There are 3 Steps involved in it

Get step-by-step solutions from verified subject matter experts