

Question: (10 points) We consider a maximization LP whose feasible region is graphed below. The tableau for the simplex method applied to this problem are on
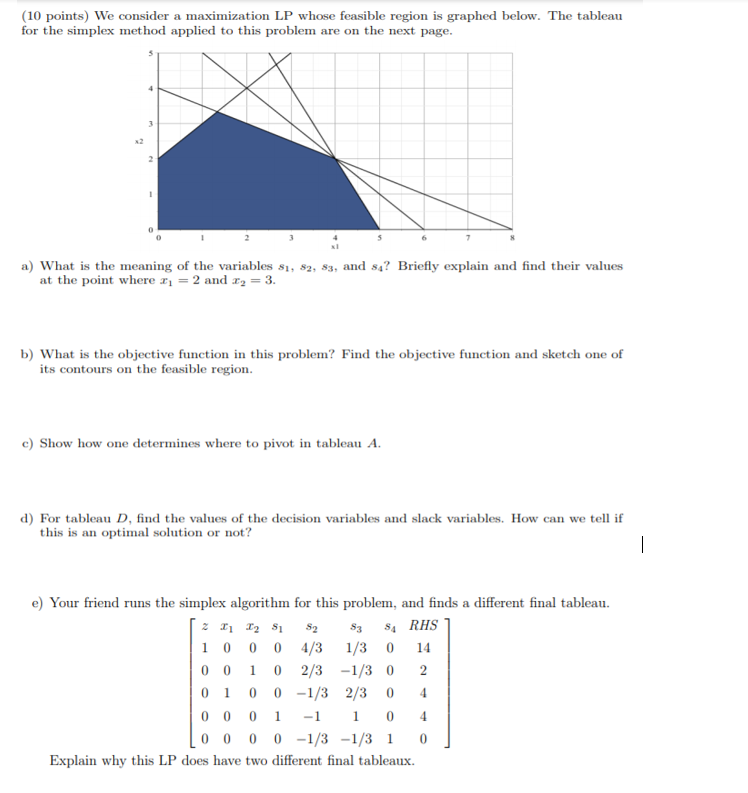
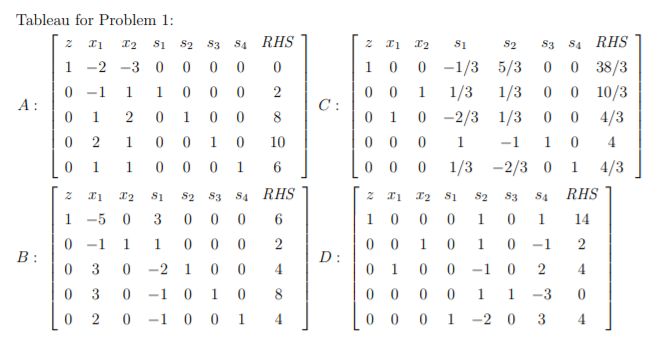
(10 points) We consider a maximization LP whose feasible region is graphed below. The tableau for the simplex method applied to this problem are on the next page. a) What is the meaning of the variables $1, $2, $3, and sa? Briefly explain and find their values at the point where 21 = 2 and c2 = 3. b) What is the objective function in this problem? Find the objective function and sketch one of its contours on the feasible region. c) Show how one determines where to pivot in tableau A. d) For tableau D, find the values of the decision variables and slack variables. How can we tell if this is an optimal solution or not? - e) Your friend runs the simplex algorithm for this problem, and finds a different final tableau. 2 1 2 51 52 53 SA RHS 0 4/3 0 14 0 0 1 0 2/3 -1/3 0 2 0 1 0 0 -1/3 2/3 0 4 0 0 0 1 1 0 4 0 0 -1/3 -1/3 1 0 Explain why this LP does have two different final tableaux.Tableau for Problem 1: 52 53 RHS RHS T1 2 51 52 53 SA 1 0 0 -1/3 5/3 0 0 38/3 1 -2 -30 0 0 0 0 0 0 1 1/3 1/3 0 0 10/3 0 -1 1 1 0 C : A : 0 1 0 -2/3 1/3 0 0 4/3 1 201 0 0 4 0 0 -1 1 0 0 2 1 0 0 1 0 10 0 1 0 0 1/3 0 0 0 0 -2/3 0 1 4/3 1 0 53 SA RHS 52 53 54 RHS 52 Z T2 S1 H 0 0 10 0 0 1 0 14 1 -5 30 0 1 0 1 0 -1 2 0 -1 1 0 0 0 2 0 0 D : 0 1 0 0 -1 2 4 B : 0 0 -2 0 0 4 3 0 1 8 0 0 -3 AO 0 3 0 -1 0 0 O 1 -2 3 15 -1 0
Step by Step Solution
There are 3 Steps involved in it

Get step-by-step solutions from verified subject matter experts