

Question: 10. Testing multiple linear restrictions with the F test Suppose a data set of 310 observations (N=310) was analyzed using OLS to examine the factors
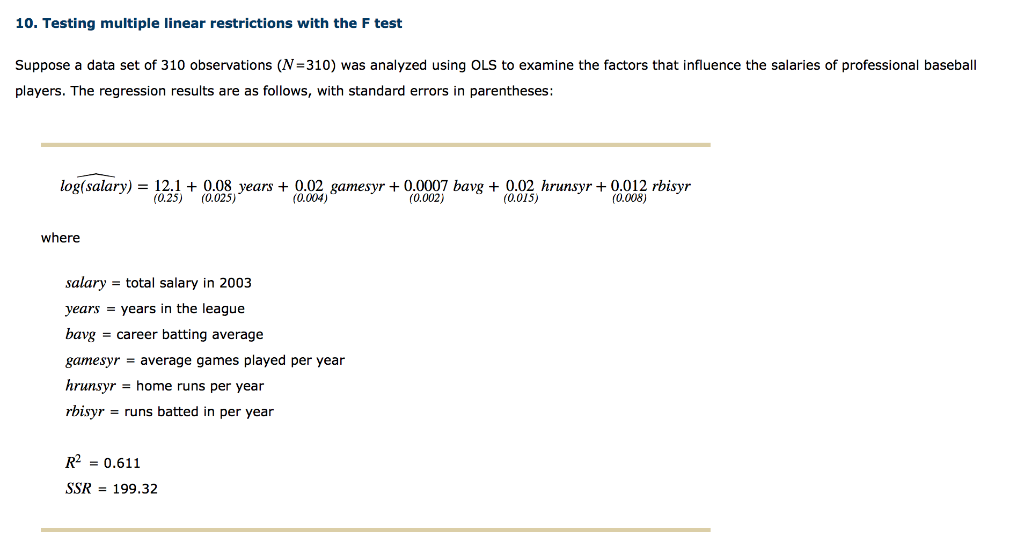
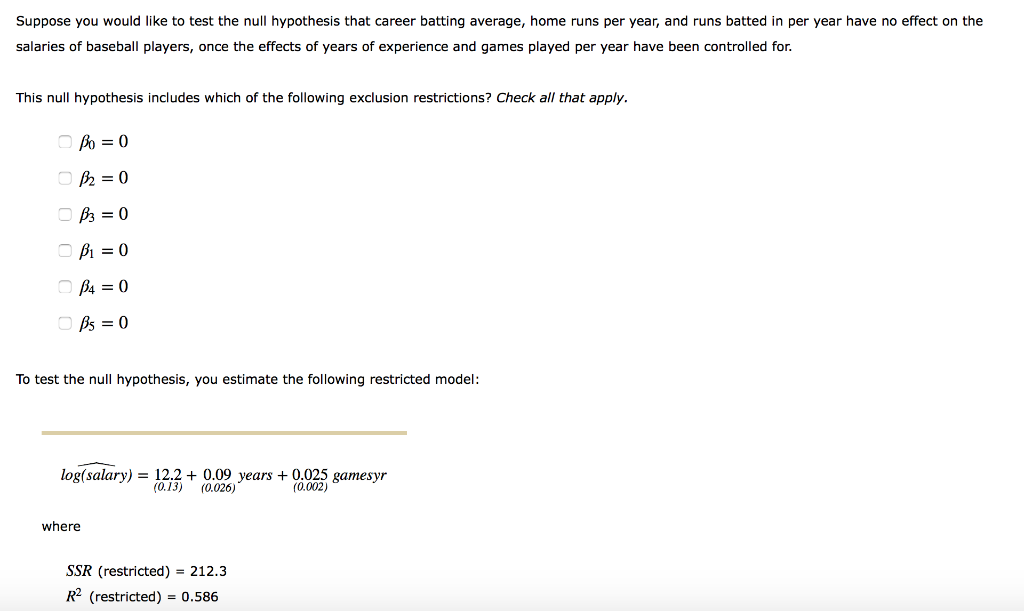
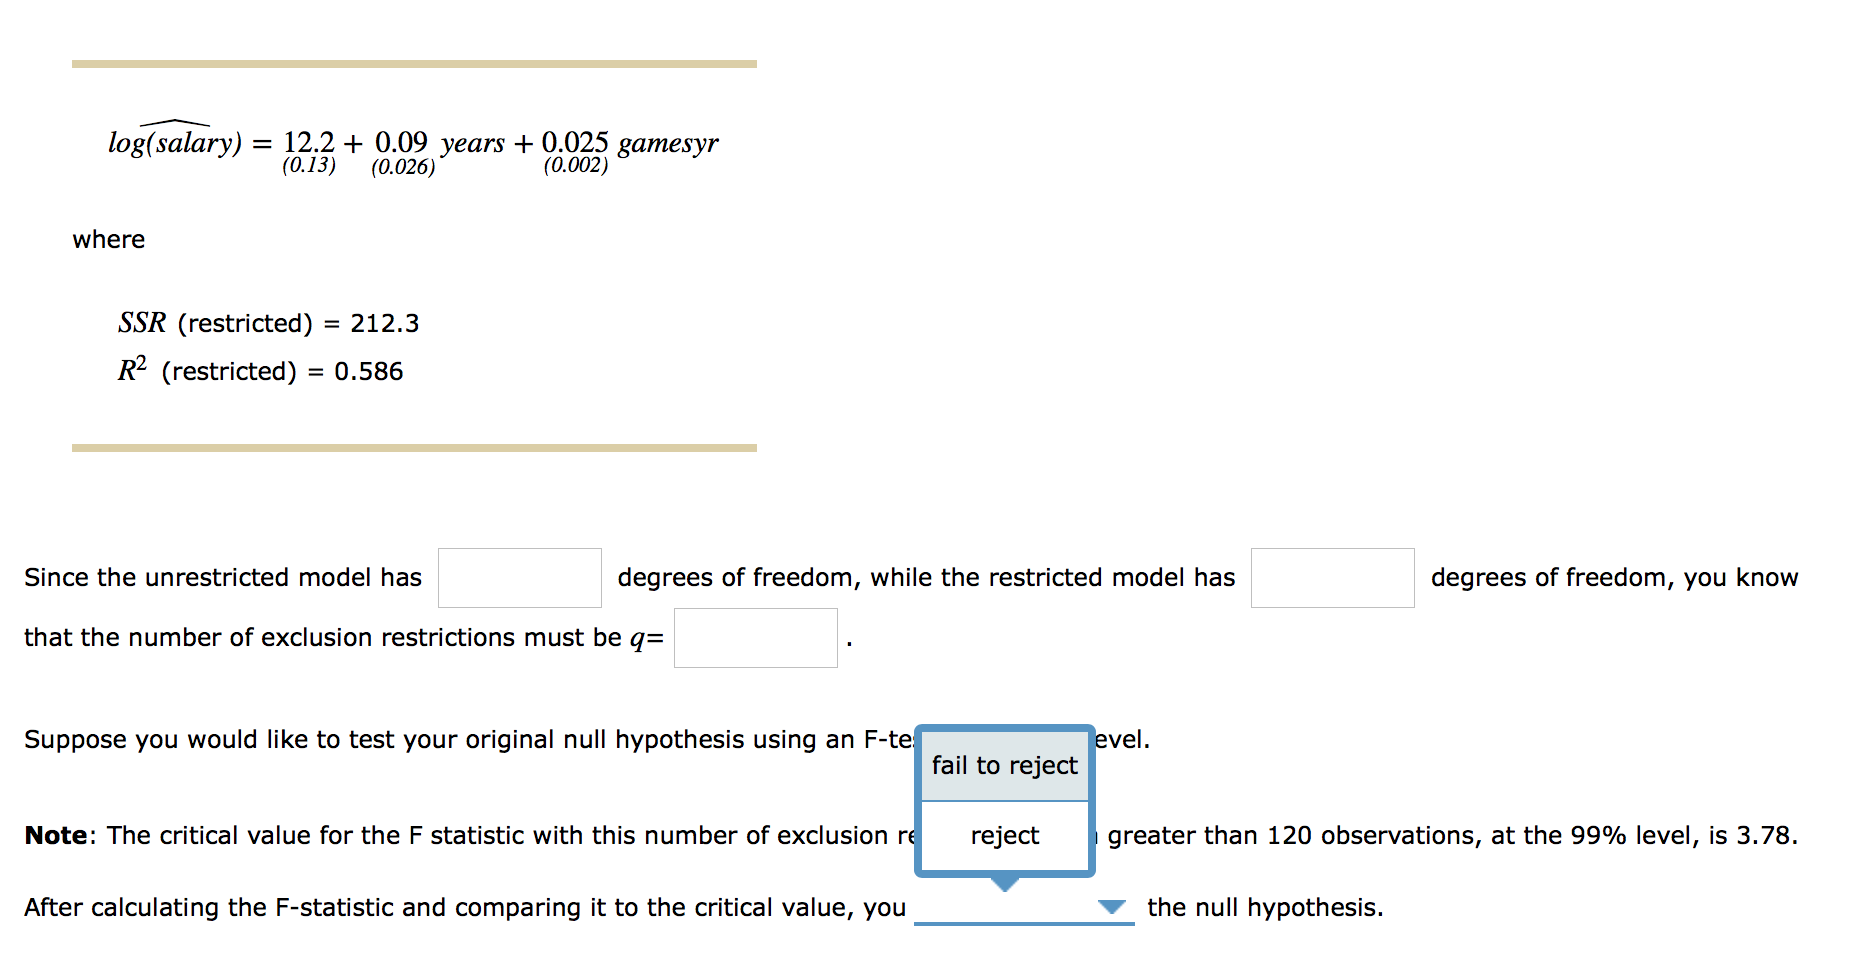
10. Testing multiple linear restrictions with the F test Suppose a data set of 310 observations (N=310) was analyzed using OLS to examine the factors that influence the salaries of professional baseball players. The regression results are as follows, with standard errors in parentheses: log(salary) = 12.1 + 0.08 years + 0.02 gamesyr +0.0007 bavg + 0.02 hrunsyr +0.012 rbisyr (0.25) (0.025) (0.004) (0.002) (0.015) (0.008) where salary = total salary in 2003 years = years in the league bavg = career batting average gamesyr = average games played per year hrunsyr = home runs per year rbisyr = runs batted in per year R2 0.611 SSR = 199.32 Suppose you would like to test the null hypothesis that career batting average, home runs per year, and runs batted in per year have no effect on the salaries of baseball players, once the effects of years of experience and games played per year have been controlled for. This null hypothesis includes which of the following exclusion restrictions? Check all that apply. Bo = 0 O2 = 0 OB3 = 0 Bi = 0 B4 = 0 OBs = 0 To test the null hypothesis, you estimate the following restricted model: log(salary) = 12.2 + 0.09 years + 0.025 gamesyr (0.13) (0.026) (0.002) where SSR (restricted) = 212.3 R2 (restricted) = 0.586 log(salary) = 12.2 + 0.09 years + 0.025 gamesyr (0.13) (0.026) (0.002) where SSR (restricted) = 212.3 R2 (restricted) = 0.586 Since the unrestricted model has degrees of freedom, while the restricted model has degrees of freedom, you know that the number of exclusion restrictions must be q= Suppose you would like to test your original null hypothesis using an F-te evel. fail to reject Note: The critical value for the F statistic with this number of exclusion re reject greater than 120 observations, at the 99% level, is 3.78. After calculating the F-statistic and comparing it to the critical value, you the null hypothesis. 10. Testing multiple linear restrictions with the F test Suppose a data set of 310 observations (N=310) was analyzed using OLS to examine the factors that influence the salaries of professional baseball players. The regression results are as follows, with standard errors in parentheses: log(salary) = 12.1 + 0.08 years + 0.02 gamesyr +0.0007 bavg + 0.02 hrunsyr +0.012 rbisyr (0.25) (0.025) (0.004) (0.002) (0.015) (0.008) where salary = total salary in 2003 years = years in the league bavg = career batting average gamesyr = average games played per year hrunsyr = home runs per year rbisyr = runs batted in per year R2 0.611 SSR = 199.32 Suppose you would like to test the null hypothesis that career batting average, home runs per year, and runs batted in per year have no effect on the salaries of baseball players, once the effects of years of experience and games played per year have been controlled for. This null hypothesis includes which of the following exclusion restrictions? Check all that apply. Bo = 0 O2 = 0 OB3 = 0 Bi = 0 B4 = 0 OBs = 0 To test the null hypothesis, you estimate the following restricted model: log(salary) = 12.2 + 0.09 years + 0.025 gamesyr (0.13) (0.026) (0.002) where SSR (restricted) = 212.3 R2 (restricted) = 0.586 log(salary) = 12.2 + 0.09 years + 0.025 gamesyr (0.13) (0.026) (0.002) where SSR (restricted) = 212.3 R2 (restricted) = 0.586 Since the unrestricted model has degrees of freedom, while the restricted model has degrees of freedom, you know that the number of exclusion restrictions must be q= Suppose you would like to test your original null hypothesis using an F-te evel. fail to reject Note: The critical value for the F statistic with this number of exclusion re reject greater than 120 observations, at the 99% level, is 3.78. After calculating the F-statistic and comparing it to the critical value, you the null hypothesis
Step by Step Solution
There are 3 Steps involved in it

Get step-by-step solutions from verified subject matter experts