

Question: 10. The data below are from an independent-measures experiment comparing three different treatment conditions regarding attention scores. Treatment 1 Treatment 2 Treatment 3 0 2
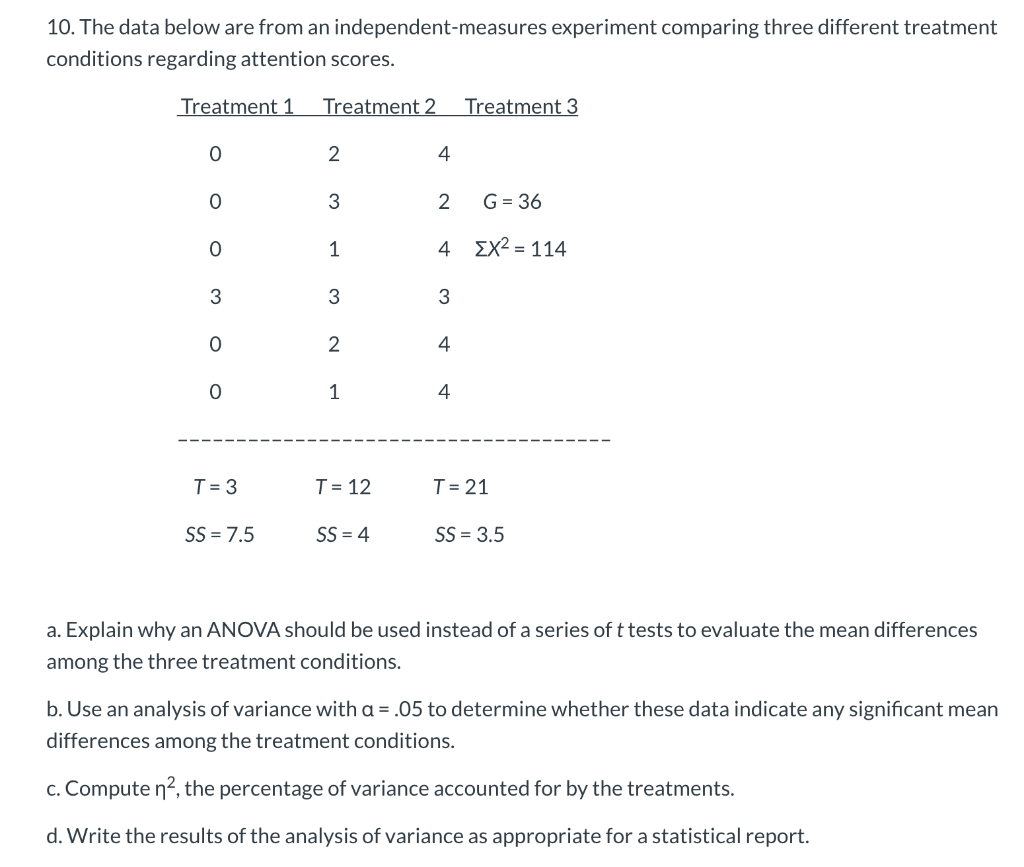
10. The data below are from an independent-measures experiment comparing three different treatment conditions regarding attention scores. Treatment 1 Treatment 2 Treatment 3 0 2 4 0 3 2 G= 36 0 1 4 EX2 = 114 3 3 3 0 2 4 0 1 4 T= 3 T = 12 T = 21 SS = 7.5 SS = 4 SS = 3.5 a. Explain why an ANOVA should be used instead of a series of t tests to evaluate the mean differences among the three treatment conditions. b. Use an analysis of variance with a = .05 to determine whether these data indicate any significant mean differences among the treatment conditions. c. Compute n2, the percentage of variance accounted for by the treatments. d. Write the results of the analysis of variance as appropriate for a statistical report. 10. The data below are from an independent-measures experiment comparing three different treatment conditions regarding attention scores. Treatment 1 Treatment 2 Treatment 3 0 2 4 0 3 2 G= 36 0 1 4 EX2 = 114 3 3 3 0 2 4 0 1 4 T= 3 T = 12 T = 21 SS = 7.5 SS = 4 SS = 3.5 a. Explain why an ANOVA should be used instead of a series of t tests to evaluate the mean differences among the three treatment conditions. b. Use an analysis of variance with a = .05 to determine whether these data indicate any significant mean differences among the treatment conditions. c. Compute n2, the percentage of variance accounted for by the treatments. d. Write the results of the analysis of variance as appropriate for a statistical report
Step by Step Solution
There are 3 Steps involved in it

Get step-by-step solutions from verified subject matter experts