

Question: 10. The table below shows different correlations between price and quantity for an agricultural producer: Corn Price ($) A (uncorrelated Revenue) B(Negative correlation) C(Positive correlation)
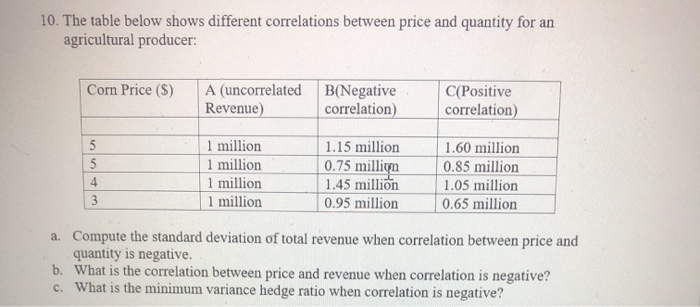
10. The table below shows different correlations between price and quantity for an agricultural producer: Corn Price ($) A (uncorrelated Revenue) B(Negative correlation) C(Positive correlation) 1 million 1 million 1 million 1 million 1.15 million 0.75 million 1.45 million 0.95 million 1.60 million 0.85 million 1.05 million 0.65 million a. Compute the standard deviation of total revenue when correlation between price and quantity is negative. b. What is the correlation between price and revenue when correlation is negative? c. What is the minimum variance hedge ratio when correlation is negative
Step by Step Solution
There are 3 Steps involved in it
1 Expert Approved Answer
Step: 1 Unlock

Question Has Been Solved by an Expert!
Get step-by-step solutions from verified subject matter experts
Step: 2 Unlock
Step: 3 Unlock